OPEN-SOURCE SCRIPT
Elder AutoEnvelope with Overbought/Oversold Levels with Labels
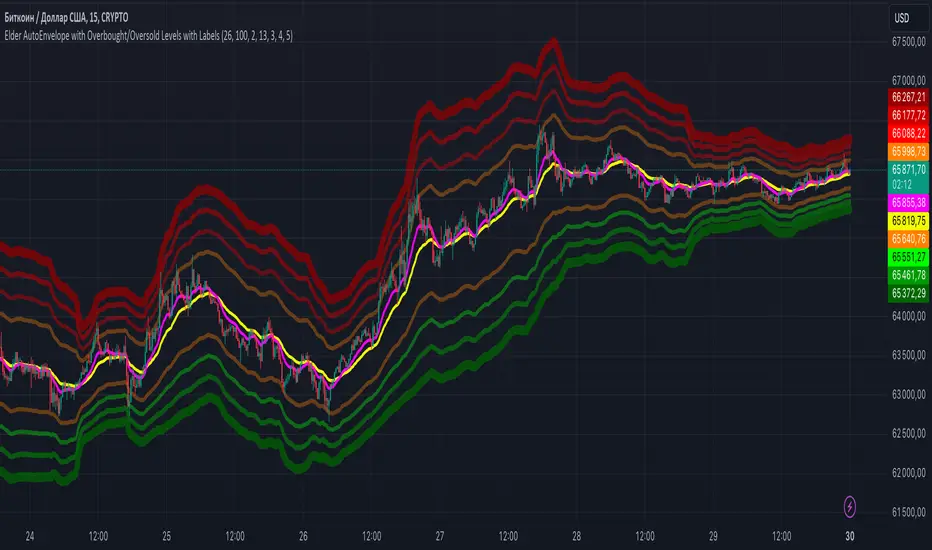
The **"Elder AutoEnvelope with Overbought/Oversold Levels with Labels"** is a technical analysis tool designed to help identify overbought and oversold levels in the market, as well as potential reversal points. It uses moving averages and price volatility to detect possible price extremes.
### Indicator Description:
- **Center EMA (26)**: Acts as the main trend line.
- **Envelope Channels**: These are constructed around the central EMA using the current price volatility. The main channel lines are determined by multiplying the standard deviation of the price by the chosen multiplier.
- **Additional Overbought/Oversold Levels**: Displayed on the chart with different colors and thicknesses to highlight small, moderate, strong, and very strong levels.
- **Labels**: Show specific levels when the price reaches areas of overbought or oversold conditions.
### How to Apply in Practice:
1. **Identifying Extremes**: The indicator shows areas where the price is considered overbought or oversold relative to the current trend. When the price touches or exceeds these levels, it can indicate a potential reversal or correction.
2. **Entry/Exit Signals**:
- **Entry on Oversold**: If the price reaches the lower Envelope lines (especially at strong or very strong oversold levels), it may be a good buying signal.
- **Exit on Overbought**: If the price touches the upper lines (especially at strong or very strong overbought levels), it signals a potential selling opportunity.
3. **Combining with Other Indicators**: It’s recommended to use this indicator alongside oscillators like RSI or MACD for signal confirmation.
4. **Trend Analysis**: The central EMA (26) helps identify the trend direction. If the price is above it, the trend is considered bullish; if below, bearish.
This indicator is particularly useful in volatile markets and helps detect price movements near highs or lows.
開源腳本
秉持TradingView一貫精神,這個腳本的創作者將其設為開源,以便交易者檢視並驗證其功能。向作者致敬!您可以免費使用此腳本,但請注意,重新發佈代碼需遵守我們的社群規範。
免責聲明
這些資訊和出版物並非旨在提供,也不構成TradingView提供或認可的任何形式的財務、投資、交易或其他類型的建議或推薦。請閱讀使用條款以了解更多資訊。
開源腳本
秉持TradingView一貫精神,這個腳本的創作者將其設為開源,以便交易者檢視並驗證其功能。向作者致敬!您可以免費使用此腳本,但請注意,重新發佈代碼需遵守我們的社群規範。
免責聲明
這些資訊和出版物並非旨在提供,也不構成TradingView提供或認可的任何形式的財務、投資、交易或其他類型的建議或推薦。請閱讀使用條款以了解更多資訊。