INVITE-ONLY SCRIPT
Crypto Breadth [MarktQuant]
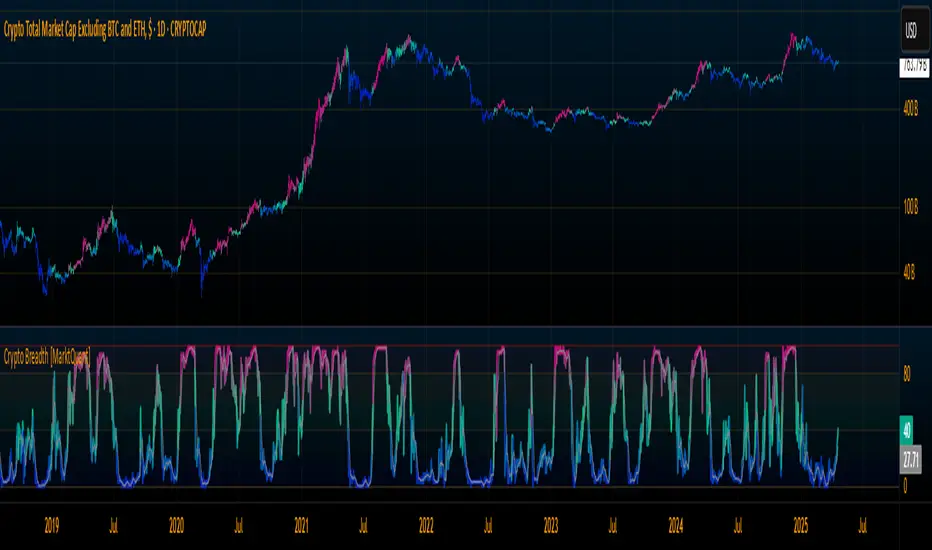
The Crypto Breadth indicator inspired by Capriole Investments is a custom market breadth tool designed to gauge the overall health and momentum of the cryptocurrency market using a diversified basket of 40 altcoins. Inspired by traditional equity market breadth models, this indicator quantifies how many assets are trading above their respective 50-period simple moving averages (SMAs), offering a high-level signal of strength or weakness in the altcoin segment.
Core Logic
Constituent Universe: The model tracks 40 prominent crypto assets including legacy names (e.g., LTC, XRP, DASH), Ethereum-based tokens (e.g., LINK, ZRX), and next-gen altcoins (e.g., RUNE, DOGE).
Breadth Score Calculation
Each asset contributes a score of 1 if it is trading above its 50-period SMA, and 0 otherwise.
Aggregate Market Breadth
The scores are summed and scaled (total_score × 2.5) to produce a final breadth reading ranging from 0 to 100.
Visual Components
Displays the scaled breadth score (0–100), colored via a gradient to highlight strength (green to red) and weakness (blue to green).
7-Day Moving Average
A smoothed trendline of breadth over the past week, useful for identifying inflections in underlying market momentum.
Market Regime Zones
Use Cases
Risk-On/Risk-Off Allocation: The breadth score acts as a tactical input for rotating between aggressive and conservative crypto exposure.
Trend Confirmation
High breadth during price rallies signals sustainable moves, while narrow participation may indicate fragility.
Bottom Fishing
Extremely low breadth levels (e.g., <20) often coincide with capitulation-like conditions, potentially highlighting accumulation opportunities.
Customization
Lookback Period: Users can adjust the SMA period to fine-tune the sensitivity of the model to price changes.
Toggle 7D MA : Enables/disables visualization of the short-term breadth average.
Remarks
This indicator is particularly useful for discretionary and systematic crypto traders looking to understand when altcoins as a group are trending or consolidating. Its visual and quantitative design offers intuitive yet robust insights for tactical decision-making.
Core Logic
Constituent Universe: The model tracks 40 prominent crypto assets including legacy names (e.g., LTC, XRP, DASH), Ethereum-based tokens (e.g., LINK, ZRX), and next-gen altcoins (e.g., RUNE, DOGE).
Breadth Score Calculation
Each asset contributes a score of 1 if it is trading above its 50-period SMA, and 0 otherwise.
Aggregate Market Breadth
The scores are summed and scaled (total_score × 2.5) to produce a final breadth reading ranging from 0 to 100.
Visual Components
Displays the scaled breadth score (0–100), colored via a gradient to highlight strength (green to red) and weakness (blue to green).
7-Day Moving Average
A smoothed trendline of breadth over the past week, useful for identifying inflections in underlying market momentum.
Market Regime Zones
- 0–20: Distressed Zone (deep risk-off)
- 20–40: Defensive Zone (caution warranted)
- 40–60: Equilibrium Zone (neutral/transitionary)
- 60–80: Accumulation Zone (early-stage strength)
- 80–100: Expansion Zone (broad bullish participation)
Use Cases
Risk-On/Risk-Off Allocation: The breadth score acts as a tactical input for rotating between aggressive and conservative crypto exposure.
Trend Confirmation
High breadth during price rallies signals sustainable moves, while narrow participation may indicate fragility.
Bottom Fishing
Extremely low breadth levels (e.g., <20) often coincide with capitulation-like conditions, potentially highlighting accumulation opportunities.
Customization
Lookback Period: Users can adjust the SMA period to fine-tune the sensitivity of the model to price changes.
Toggle 7D MA : Enables/disables visualization of the short-term breadth average.
Remarks
This indicator is particularly useful for discretionary and systematic crypto traders looking to understand when altcoins as a group are trending or consolidating. Its visual and quantitative design offers intuitive yet robust insights for tactical decision-making.
僅限邀請腳本
僅作者批准的使用者才能訪問此腳本。您需要申請並獲得使用許可,通常需在付款後才能取得。更多詳情,請依照作者以下的指示操作,或直接聯絡MarktQuant。
請注意,此私人、僅限受邀使用者使用的腳本未經腳本審核員審核,其是否符合社群規範尚待確定。 TradingView不建議在未完全信任作者並了解其運作方式的情況下購買或使用腳本。您也可以在我們的社群腳本中找到免費的開源替代方案。
作者的說明
Included in Basic and Premium MarktQuant memberships—enjoy analyzing trends and spotting key levels! https://marktquant.com/products/membership
🔍 Access Investing Strategies & Indicators
📊 whop.com/marktquant
🌐 marktquant.com
Nothing shared on this page constitutes financial advice. All information, tools, and analyses are provided solely for informational and educational purposes.
📊 whop.com/marktquant
🌐 marktquant.com
Nothing shared on this page constitutes financial advice. All information, tools, and analyses are provided solely for informational and educational purposes.
免責聲明
這些資訊和出版物並非旨在提供,也不構成TradingView提供或認可的任何形式的財務、投資、交易或其他類型的建議或推薦。請閱讀使用條款以了解更多資訊。