OPEN-SOURCE SCRIPT
SA_EMA Combo + UT Bot
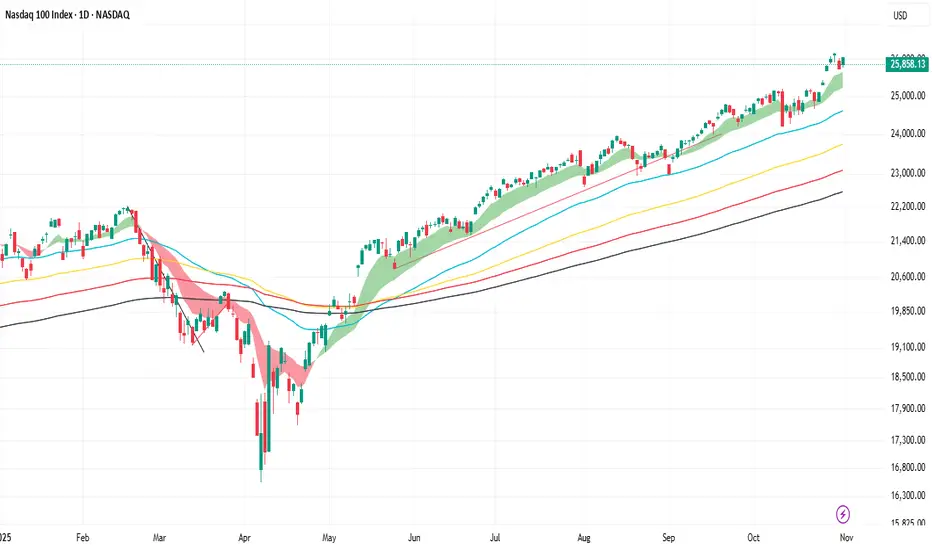
EMA Combo + UT Bot is an indicator designed to make it easier to track trend direction and momentum reversals on the same chart.
The indicator combines multiple EMA lines (50/100/150/200) with a short- and medium-term EMA cloud. This cloud visually shows whether the market is in a bullish or bearish trend through color changes.
In addition, it uses the UT Bot algorithm to generate buy and sell signals adapted to market volatility. These signals are triggered when the price crosses the ATR-based trailing stop level.
Users can choose to use Heikin Ashi candles and adjust signal sensitivity via the Key Value parameter. This allows traders to follow overall trends and potential reversal zones using a single tool.
Disclaimer: This indicator is for technical analysis purposes only and should not be considered financial advice.
Developed for Future Alpha Club.
開源腳本
秉持TradingView一貫精神,這個腳本的創作者將其設為開源,以便交易者檢視並驗證其功能。向作者致敬!您可以免費使用此腳本,但請注意,重新發佈代碼需遵守我們的社群規範。
免責聲明
這些資訊和出版物並非旨在提供,也不構成TradingView提供或認可的任何形式的財務、投資、交易或其他類型的建議或推薦。請閱讀使用條款以了解更多資訊。
開源腳本
秉持TradingView一貫精神,這個腳本的創作者將其設為開源,以便交易者檢視並驗證其功能。向作者致敬!您可以免費使用此腳本,但請注意,重新發佈代碼需遵守我們的社群規範。
免責聲明
這些資訊和出版物並非旨在提供,也不構成TradingView提供或認可的任何形式的財務、投資、交易或其他類型的建議或推薦。請閱讀使用條款以了解更多資訊。