OPEN-SOURCE SCRIPT
已更新 ATR Pivot Point Index [racer8]
Description:
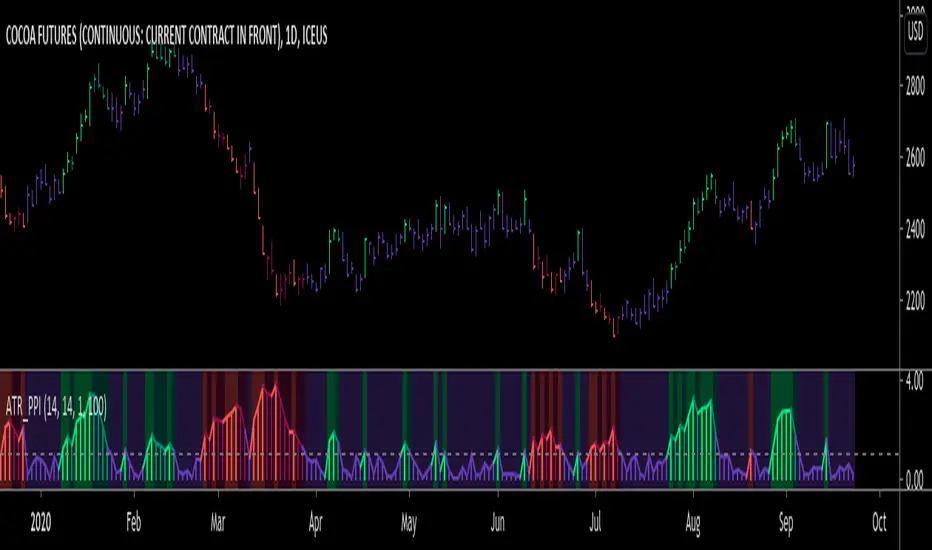
ATR Pivot Point Index (ATR_PPI) is based on the theory of mean reversion.
I was inspired to create this indicator after watching a particular YouTube video on the UKspreadbetting channel.
In this video, the trader being interviewed mentioned that he would exit when price is too far from the moving average.
In other words, he exits when he thinks price will revert back to the moving average (mean reversion).
I'm not sure what period moving average he used, so I set it to the standard 14 periods.
I wanted to quantify his strategy so that the user can consistently exit a trade at a fixed distance away from the moving average.
For this indicator, this distance is in ATR units.
This strategy of exiting is known as the mean reversion exit strategy.
Alternatively, if the user wishes to, this indicator can also be used as an entry indicator (Trend entry strategy).
---------------------------------------------------------------------------------------------------------------------------------------------------------------------------------
Parameters:
1. Sma Period - controls length of moving average (Affects histogram).
2. Atr Period - controls length of Atr, doesn't have much affect on indicator (Affects histogram).
3. Atr Pivot Point Level - controls horizontal line, it determines how far away in Atr units you want to exit/enter from the sma for every trade.
---------------------------------------------------------------------------------------------------------------------------------------------------------------------------------
Interpreting signals:
(Trend entry strategy) When histogram is...
Green - enter long
Red - enter short
Purple - No signal
(Mean reversion exit strategy) When histogram is...
Green - exit long
Red - exit short
Purple - No signal
---------------------------------------------------------------------------------------------------------------------------------------------------------------------------------
Calculation:
Distance = Absolute value of (current close - moving average(14))
ATR_units = Distance / ATR(14) ...........Plot as histogram.
Add horizontal line set at (2)*ATR .......Plot line.
Is histogram > line?
Yes, histogram color is green/red.
No, histogram color is purple.
Note: For mean reversion exit strategy, I recommend HIGHER Atr Pivot Point Level values. Vice versa for trend entry strategy.
Enjoy :)
發行說明
Minor fix of code.發行說明
...Changed ATR Pivot Point Level to a default value of 1 instead of 2.
Changed consolidation color from purple to gray :D
發行說明
>>>- Changed consolidation color to indigo. Indigo is a rich color between blue and violet on the visible spectrum, it's a dark purplish blue.
- "ATR pivot point level" is now called "ATR level".
發行說明
>>>Added a simple moving average for the histogram.
發行說明
>>>Added option to show baseline (moving avg of histogram).
發行說明
Added bar colors.發行說明
All values are now to 2 decimal places.開源腳本
秉持TradingView一貫精神,這個腳本的創作者將其設為開源,以便交易者檢視並驗證其功能。向作者致敬!您可以免費使用此腳本,但請注意,重新發佈代碼需遵守我們的社群規範。
免責聲明
這些資訊和出版物並非旨在提供,也不構成TradingView提供或認可的任何形式的財務、投資、交易或其他類型的建議或推薦。請閱讀使用條款以了解更多資訊。
免責聲明
這些資訊和出版物並非旨在提供,也不構成TradingView提供或認可的任何形式的財務、投資、交易或其他類型的建議或推薦。請閱讀使用條款以了解更多資訊。