OPEN-SOURCE SCRIPT
Moving Averages Histogram
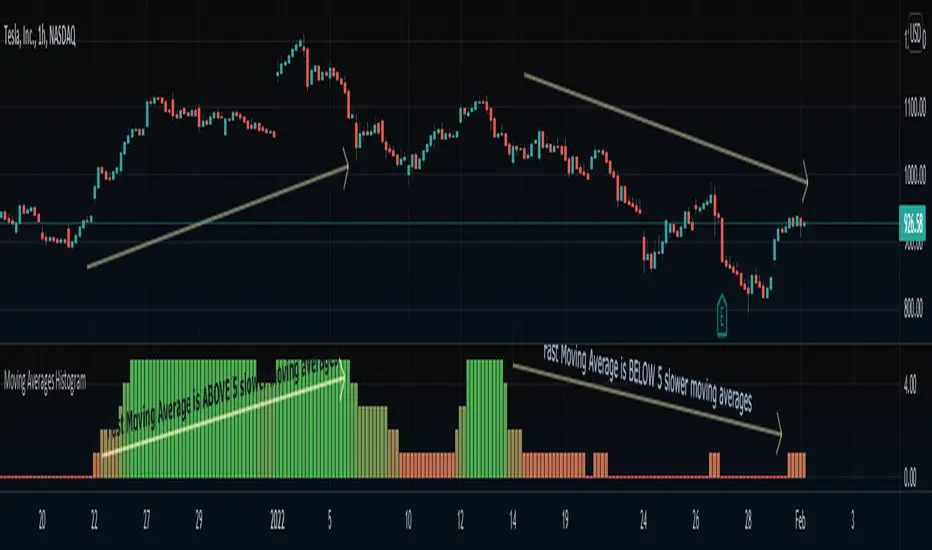
An interesting idea is to simplify the display of whether ONE fast-moving average crosses FIVE other slower-moving averages using just a histogram.
The idea is to increase the step counter by 1 every time a fast-moving average crosses OVER one of the five slower-moving averages until reaching 5 (highest value) and decrease the step counter by 1 every time the fast-moving average crosses UNDER each one of the five slower moving averages until reaching 0 (lowest value of the histogram).
=== Cut To Chase ===
If the histogram is at the top value 5 (green), it means the FAST moving average is ABOVE ALL slower-moving averages, Hench, the asset is up trending.
If the histogram is at the bottom value 0 (red), it means the FAST moving average is BELOW ALL slower-moving averages, Hench, the asset is down trending.
If the histogram is in the midways between 0 to 5, it means the FAST moving average is starting to cross the slower moving averages which could lead to a trend reversal, up or down, it depends on the direction of the crossing.
=== Notes ===
You can change from a variety of moving averages like RMA, EMA, ALMA, HMA, and so on.
You can reduce the number of slow-moving averages by placing the same length.
You can visualize the moving averages in case you want to see how it works behind, by going to settings and clicking 'Show MA lines'.
Every moving average length can be modified inside settings.
Note that the fast-moving average should have the lowest length.
You can visualize how the moving average is plotted:
開源腳本
秉持TradingView一貫精神,這個腳本的創作者將其設為開源,以便交易者檢視並驗證其功能。向作者致敬!您可以免費使用此腳本,但請注意,重新發佈代碼需遵守我們的社群規範。
Appreciation of my work: paypal.me/dman103
All Premium indicators: algo.win
LIVE Stream - Pivot Points Algo: youtube.com/channel/UCFyqab-i0xb2jf-c18ufH0A/live
All Premium indicators: algo.win
LIVE Stream - Pivot Points Algo: youtube.com/channel/UCFyqab-i0xb2jf-c18ufH0A/live
免責聲明
這些資訊和出版物並非旨在提供,也不構成TradingView提供或認可的任何形式的財務、投資、交易或其他類型的建議或推薦。請閱讀使用條款以了解更多資訊。