OPEN-SOURCE SCRIPT
Serajian Oscillator
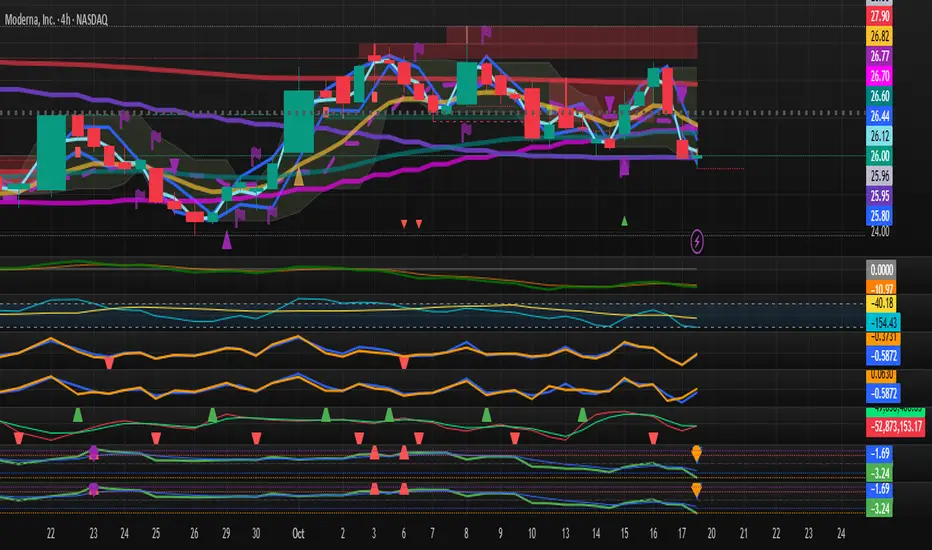
Unleash the power of momentum with the Serajian Oscillator! This innovative indicator tracks the normalized difference between price and volume Rate of Change (ROC), delivering a vibrant oscillator with a 5-period EMA for visual guidance. Spot high-probability reversals with striking markers at the chart’s bottom: red triangles signal overbought conditions (> +2.0), blue triangles highlight oversold zones (< -2.0), purple diamonds flag extreme overbought levels (> +3.0), and orange diamonds pinpoint extreme oversold opportunities (< -3.0). Stay ahead with instant alerts on zone entries! Perfect for traders hunting reversals in stocks, forex, or crypto, the Serajian Oscillator lets you fine-tune ROC Period, Normalization Period, and zone thresholds to match your strategy.
**Important**: Like all indicators, the Serajian Oscillator can generate false signals and should not be used alone. Always combine it with other technical analysis tools, price action, or market context for confirmation. This indicator is provided for informational purposes only. Traders are solely responsible for thoroughly backtesting and validating its performance before use. The author is not responsible for any financial losses or decisions made based on this indicator. Use at your own risk and dive into the action wisely!
**Important**: Like all indicators, the Serajian Oscillator can generate false signals and should not be used alone. Always combine it with other technical analysis tools, price action, or market context for confirmation. This indicator is provided for informational purposes only. Traders are solely responsible for thoroughly backtesting and validating its performance before use. The author is not responsible for any financial losses or decisions made based on this indicator. Use at your own risk and dive into the action wisely!
開源腳本
本著TradingView的真正精神,此腳本的創建者將其開源,以便交易者可以查看和驗證其功能。向作者致敬!雖然您可以免費使用它,但請記住,重新發佈程式碼必須遵守我們的網站規則。
免責聲明
這些資訊和出版物並不意味著也不構成TradingView提供或認可的金融、投資、交易或其他類型的意見或建議。請在使用條款閱讀更多資訊。
開源腳本
本著TradingView的真正精神,此腳本的創建者將其開源,以便交易者可以查看和驗證其功能。向作者致敬!雖然您可以免費使用它,但請記住,重新發佈程式碼必須遵守我們的網站規則。
免責聲明
這些資訊和出版物並不意味著也不構成TradingView提供或認可的金融、投資、交易或其他類型的意見或建議。請在使用條款閱讀更多資訊。