PROTECTED SOURCE SCRIPT
已更新 Volume Buzz - Real-Time Relative Volume Monitor
Don't trade in the dark—know if the market is paying attention.
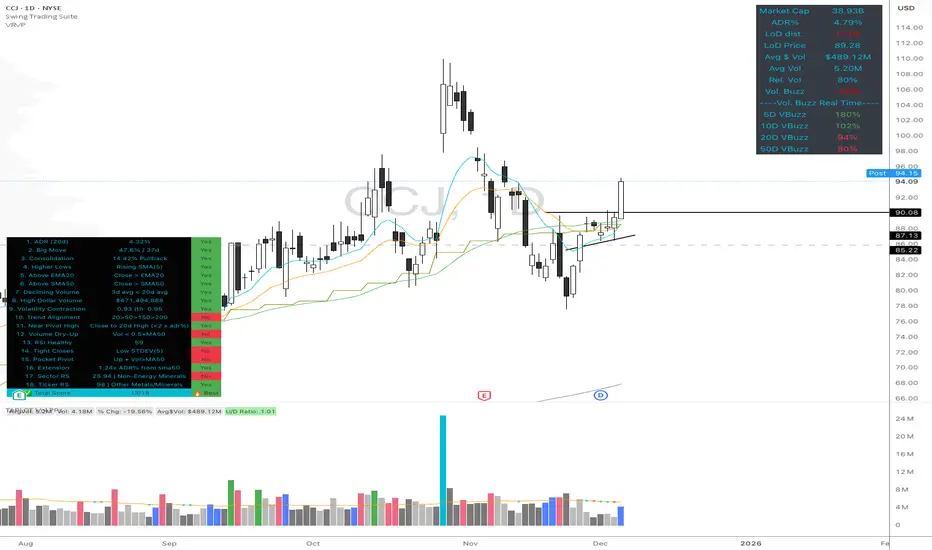
This indicator displays a simple dashboard on your chart that tells you if the current volume is Higher or Lower than the 20-day average for this specific time of day.
Green Text: High Relative Volume (RVol > 1). Good for spotting breakouts and momentum.
Red Text: Low Relative Volume (RVol < 1). Indicates consolidation or lack of interest.
Includes an optional "Realtime Adjustment" to predict the volume closing value before the bar actually closes.
發行說明
compare to multiple days發行說明
added real time volume buzz (relative volume by time)受保護腳本
此腳本以閉源形式發佈。 不過,您可以自由使用,沒有任何限制 — 點擊此處了解更多。
免責聲明
這些資訊和出版物並非旨在提供,也不構成TradingView提供或認可的任何形式的財務、投資、交易或其他類型的建議或推薦。請閱讀使用條款以了解更多資訊。
受保護腳本
此腳本以閉源形式發佈。 不過,您可以自由使用,沒有任何限制 — 點擊此處了解更多。
免責聲明
這些資訊和出版物並非旨在提供,也不構成TradingView提供或認可的任何形式的財務、投資、交易或其他類型的建議或推薦。請閱讀使用條款以了解更多資訊。