OPEN-SOURCE SCRIPT
已更新 Quant Signals: Econophysics-based Momentum
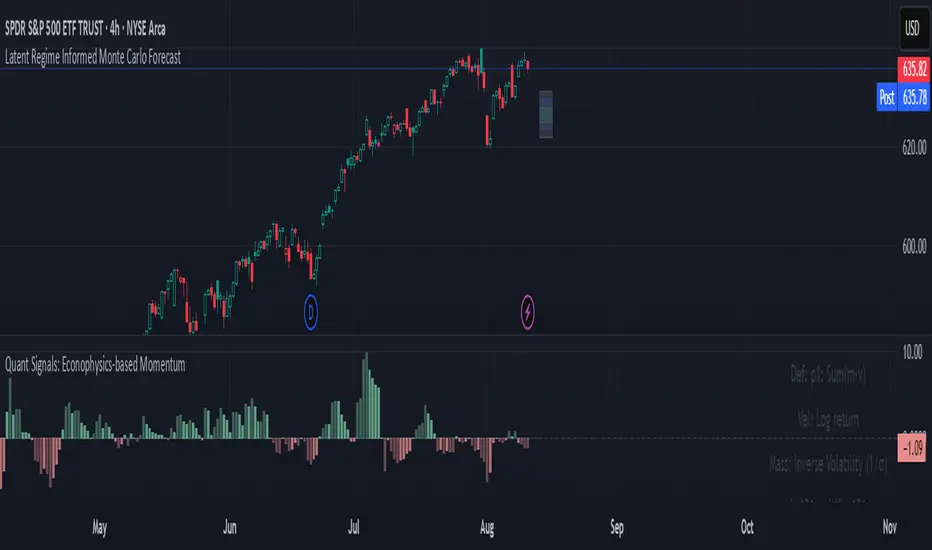
Physical Momentum Switcher (p0 / p1 / p2 / p3)
This indicator implements a “physical momentum” concept from quantitative finance research, where momentum is defined similarly to physics:
Momentum (p) = Mass × Velocity
Instead of using only the standard cumulative return (classic momentum), it lets you switch between multiple definitions:
Velocity can be measured as:
Mass (for p1/p2) can be defined as:
Features:
Typical uses:
Momentum trading: Buy when PM > 0 (or crosses above the signal), sell/short when PM < 0 (or crosses below).
Contrarian strategies: Reverse the logic when testing mean-reversion effects.
Cross-asset testing: Apply to different instruments to see which PM definition works best.
This indicator implements a “physical momentum” concept from quantitative finance research, where momentum is defined similarly to physics:
Momentum (p) = Mass × Velocity
Instead of using only the standard cumulative return (classic momentum), it lets you switch between multiple definitions:
- p0: Cumulative return over the lookback period (no mass, just price change).
- p1: Sum of (mass × velocity) over the lookback period.
- p2: Weighted average velocity = (Σ mass×velocity) ÷ (Σ mass).
- p3: Sharpe-like momentum = average velocity ÷ volatility (massless).
Velocity can be measured as:
- Log return: ln(Pt / Pt-1)
- Normal return: (Pt / Pt-1 – 1)
Mass (for p1/p2) can be defined as:
- Unit mass (1) — equal weighting, equivalent to traditional momentum.
- Turnover proxy — Volume ÷ average volume over k bars.
- Value turnover proxy — Dollar volume ÷ average dollar volume.
- Inverse volatility — 1 ÷ return volatility over a specified period.
Features:
- Switchable momentum definition, velocity type, and mass type.
- Adjustable lookback (k) and smoothing period for the signal line.
- Optional ±1σ display bands for quick overbought/oversold visual cues.
- Alerts for crosses above/below zero or the signal line.
- Table display summarizing current settings and values.
Typical uses:
Momentum trading: Buy when PM > 0 (or crosses above the signal), sell/short when PM < 0 (or crosses below).
Contrarian strategies: Reverse the logic when testing mean-reversion effects.
Cross-asset testing: Apply to different instruments to see which PM definition works best.
發行說明
Added histogram view開源腳本
秉持TradingView一貫精神,這個腳本的創作者將其設為開源,以便交易者檢視並驗證其功能。向作者致敬!您可以免費使用此腳本,但請注意,重新發佈代碼需遵守我們的社群規範。
免責聲明
這些資訊和出版物並非旨在提供,也不構成TradingView提供或認可的任何形式的財務、投資、交易或其他類型的建議或推薦。請閱讀使用條款以了解更多資訊。
免責聲明
這些資訊和出版物並非旨在提供,也不構成TradingView提供或認可的任何形式的財務、投資、交易或其他類型的建議或推薦。請閱讀使用條款以了解更多資訊。