OPEN-SOURCE SCRIPT
已更新 Price Change Rate

Price Change Rate (PCR)
Description:
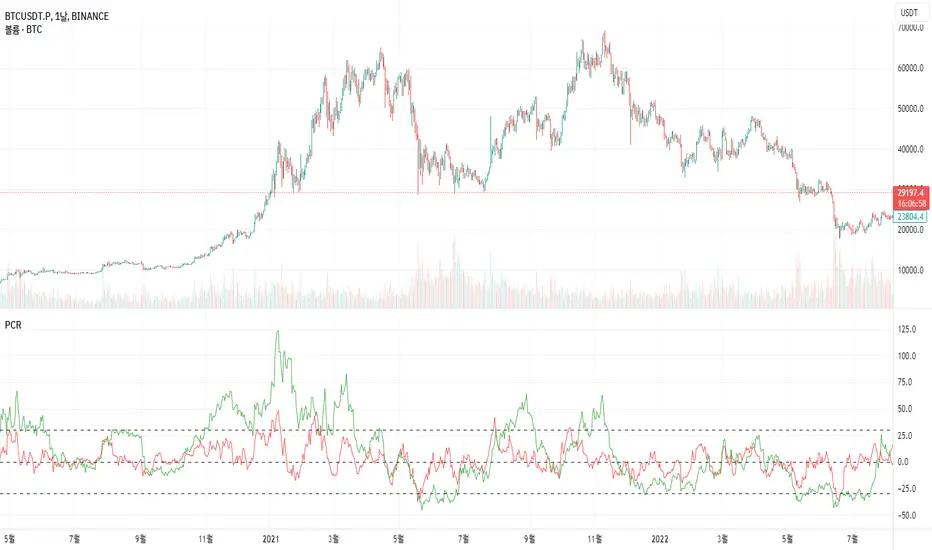
The "Price Change Rate" (PCR) indicator is a customized tool designed to visualize the rate of price change over different periods. The PCR indicator plots three separate lines, each representing a distinct length of time. Each line represents the percentage change in price from the start of its designated period.
Usage:
Setting up the indicator:
To use the PCR indicator, simply add it to your TradingView chart. In the settings panel, you will find three different lengths to input: Length 1, Length 2, Length 3. These lengths represent the periods (in days) over which the price change is calculated. Input your desired lengths for each.
Understanding the output:
The Price Change Rate 1 line (colored in red) represents the rate of price change over the period defined in Length 1.
The Price Change Rate 2 line (colored in green) represents the rate of price change over the period defined in Length 2.
The Price Change Rate 3 line (colored in blue) represents the rate of price change over the period defined in Length 3.
The lines move in accordance with the rate of price change. For example, if the Price Change Rate 1 line is above 0, it means the price has increased in the period defined in Length 1.
Purpose:
The purpose of the PCR indicator is to give a visual representation of how the price of an asset is changing over multiple periods. By comparing the three lines, you can get a sense of the momentum of the price change and potentially identify trends or shifts in market sentiment.
Limitations:
Like all indicators, the PCR should not be used in isolation. Consider combining it with other indicators and tools to improve the accuracy of your analysis.
Remember, historical performance is not indicative of future results. Always use proper risk management and ensure your strategies align with your investment goals.
發行說明
Patch Notes for Price Change Rate Indicator - Version 1.1In this update, we've made several enhancements to improve usability and give users more control over how they view their indicators. Here's what's new:
Added Reference Lines: For a better visualization, we've added three reference horizontal lines. By default, these lines are at 0, 30, and -30.
The 0 line, termed as the "Zero Line", serves as the neutral line in the chart. It shows where the price change rate shifts from positive to negative or vice versa.
The 30 line, or the "Upper Bound", acts as an overbought line. When the price change rate crosses this level upwards, the asset might be considered overbought.
The -30 line, or the "Lower Bound", acts as an oversold line. If the price change rate crosses this level downwards, the asset might be considered oversold.
User-defined Reference Line Levels: Users now have the flexibility to change the levels of the "Upper Bound" and "Lower Bound" lines according to their trading strategy. This lets users tailor the indicator to better suit their individual needs.
Enhanced Color Visibility: All reference lines are colored black for stark contrast and clear visibility against the red, green, and blue lines of the Price Change Rate.
Configurable 'Price Change Rate 3' Indicator: By default, the "Price Change Rate 3" line is disabled (hidden from the chart). However, users can now enable it by setting a value greater than 0 and change it's color to its corresponding length in the settings. This provides users with more control over their charts, allowing them to view only the indicators that they deem necessary.
This version of the Price Change Rate Indicator aims to provide users with more flexibility, better control, and clearer visual aids to assist in their trading strategy.
開源腳本
秉持TradingView一貫精神,這個腳本的創作者將其設為開源,以便交易者檢視並驗證其功能。向作者致敬!您可以免費使用此腳本,但請注意,重新發佈代碼需遵守我們的社群規範。
免責聲明
這些資訊和出版物並非旨在提供,也不構成TradingView提供或認可的任何形式的財務、投資、交易或其他類型的建議或推薦。請閱讀使用條款以了解更多資訊。
開源腳本
秉持TradingView一貫精神,這個腳本的創作者將其設為開源,以便交易者檢視並驗證其功能。向作者致敬!您可以免費使用此腳本,但請注意,重新發佈代碼需遵守我們的社群規範。
免責聲明
這些資訊和出版物並非旨在提供,也不構成TradingView提供或認可的任何形式的財務、投資、交易或其他類型的建議或推薦。請閱讀使用條款以了解更多資訊。