OPEN-SOURCE SCRIPT
Ross Cameron-Inspired Day Trading Strategy
Explanation for Community Members:
Title: Ross Cameron-Inspired Day Trading Strategy
Description:
This script is designed to help you identify potential buy and sell opportunities during the trading day. It combines several popular trading strategies to provide clear signals.
Key Features:
Gap and Go: Identifies stocks that have gapped up or down at the open.
Momentum Trading: Uses RSI and EMA to identify momentum-based entry points.
Mean Reversion: Uses RSI and SMA to identify potential reversals.
How to Use:
Apply to Chart: Add this script to your TradingView chart.
Set Timeframe: Works best on 5-minute and 10-minute timeframes.
Watch for Signals: Look for green "BUY" labels for entry points and red "SELL" labels for exit points.
Parameters:
Gap Percentage: Adjust to identify larger or smaller gaps.
RSI Settings: Customize the RSI length and overbought/oversold levels.
EMA and SMA Lengths: Adjust the lengths of the moving averages.
Confirmation Period: Set how many bars to wait for confirmation.
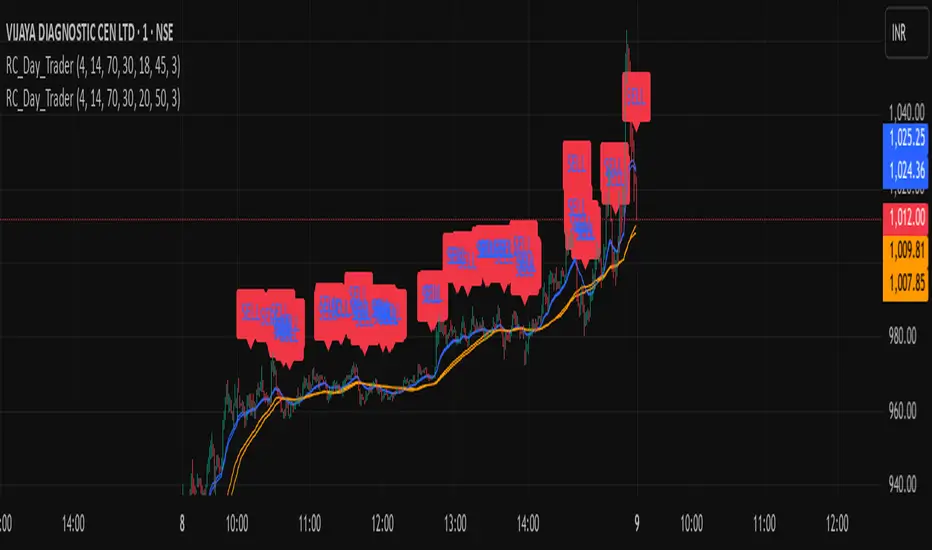
Visual Elements:
BUY Signals: Green labels below the price bars.
SELL Signals: Red labels above the price bars.
Indicators: Displays EMA (blue) and SMA (orange) for additional context.
This script is a powerful tool for day trading on NSE and BSE indices, combining multiple strategies to provide robust trading signals. Adjust the parameters to suit your trading style and always combine with your own analysis for best results.
Title: Ross Cameron-Inspired Day Trading Strategy
Description:
This script is designed to help you identify potential buy and sell opportunities during the trading day. It combines several popular trading strategies to provide clear signals.
Key Features:
Gap and Go: Identifies stocks that have gapped up or down at the open.
Momentum Trading: Uses RSI and EMA to identify momentum-based entry points.
Mean Reversion: Uses RSI and SMA to identify potential reversals.
How to Use:
Apply to Chart: Add this script to your TradingView chart.
Set Timeframe: Works best on 5-minute and 10-minute timeframes.
Watch for Signals: Look for green "BUY" labels for entry points and red "SELL" labels for exit points.
Parameters:
Gap Percentage: Adjust to identify larger or smaller gaps.
RSI Settings: Customize the RSI length and overbought/oversold levels.
EMA and SMA Lengths: Adjust the lengths of the moving averages.
Confirmation Period: Set how many bars to wait for confirmation.
Visual Elements:
BUY Signals: Green labels below the price bars.
SELL Signals: Red labels above the price bars.
Indicators: Displays EMA (blue) and SMA (orange) for additional context.
This script is a powerful tool for day trading on NSE and BSE indices, combining multiple strategies to provide robust trading signals. Adjust the parameters to suit your trading style and always combine with your own analysis for best results.
開源腳本
秉持TradingView一貫精神,這個腳本的創作者將其設為開源,以便交易者檢視並驗證其功能。向作者致敬!您可以免費使用此腳本,但請注意,重新發佈代碼需遵守我們的社群規範。
免責聲明
這些資訊和出版物並非旨在提供,也不構成TradingView提供或認可的任何形式的財務、投資、交易或其他類型的建議或推薦。請閱讀使用條款以了解更多資訊。
免責聲明
這些資訊和出版物並非旨在提供,也不構成TradingView提供或認可的任何形式的財務、投資、交易或其他類型的建議或推薦。請閱讀使用條款以了解更多資訊。