OPEN-SOURCE SCRIPT
VIX SPX & XJO
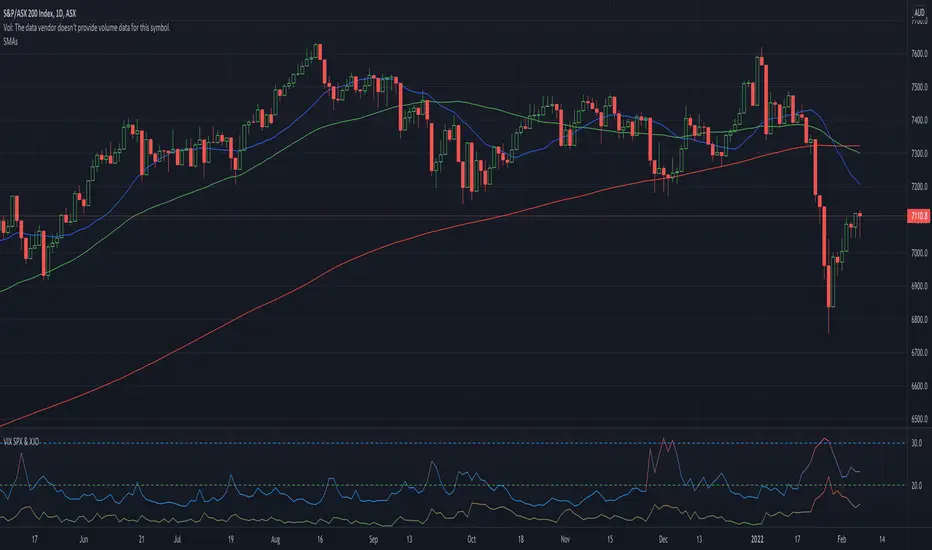
Vix is a volatility indicator that lets traders know when to be cautious.
This indicator shows the volatility for the US market as well as the Australian market on seperate lines.
Blue lines are Vix for SPX (S&P 500)
If blue indicator goes above 30, high volatility is present and caution should be taken.
Green lines are Vix for XJO (ASX 200)
If green indicator goes above 20, high volatility is present and caution should be taken.
開源腳本
秉持TradingView一貫精神,這個腳本的創作者將其設為開源,以便交易者檢視並驗證其功能。向作者致敬!您可以免費使用此腳本,但請注意,重新發佈代碼需遵守我們的社群規範。
免責聲明
這些資訊和出版物並非旨在提供,也不構成TradingView提供或認可的任何形式的財務、投資、交易或其他類型的建議或推薦。請閱讀使用條款以了解更多資訊。
免責聲明
這些資訊和出版物並非旨在提供,也不構成TradingView提供或認可的任何形式的財務、投資、交易或其他類型的建議或推薦。請閱讀使用條款以了解更多資訊。