OPEN-SOURCE SCRIPT
Revolution Kagi Reversal Amount Indicator
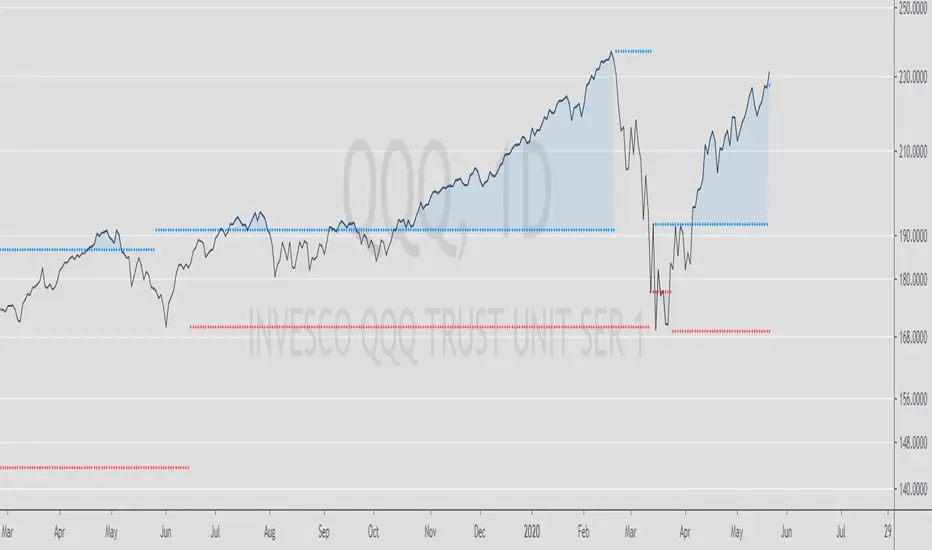
This is one of my favorite indicators. You simply type in the significant price levels for whatever asset you are trading and it will plot pivots accordingly. As in title, the indicator is based on the fantastic Kagi reversal indicator.
For instance, if, say, brent crude oil is trading at $60, you can assume that $10 and $5 will be significant price levels. If gold is trading at $1500, $100 and $500 might be significant and so on.
For instance, if, say, brent crude oil is trading at $60, you can assume that $10 and $5 will be significant price levels. If gold is trading at $1500, $100 and $500 might be significant and so on.
開源腳本
秉持TradingView一貫精神,這個腳本的創作者將其設為開源,以便交易者檢視並驗證其功能。向作者致敬!您可以免費使用此腳本,但請注意,重新發佈代碼需遵守我們的社群規範。
免責聲明
這些資訊和出版物並非旨在提供,也不構成TradingView提供或認可的任何形式的財務、投資、交易或其他類型的建議或推薦。請閱讀使用條款以了解更多資訊。
開源腳本
秉持TradingView一貫精神,這個腳本的創作者將其設為開源,以便交易者檢視並驗證其功能。向作者致敬!您可以免費使用此腳本,但請注意,重新發佈代碼需遵守我們的社群規範。
免責聲明
這些資訊和出版物並非旨在提供,也不構成TradingView提供或認可的任何形式的財務、投資、交易或其他類型的建議或推薦。請閱讀使用條款以了解更多資訊。