OPEN-SOURCE SCRIPT
@Cross_Media&Pivot&TRADE_Entry_and_Exit
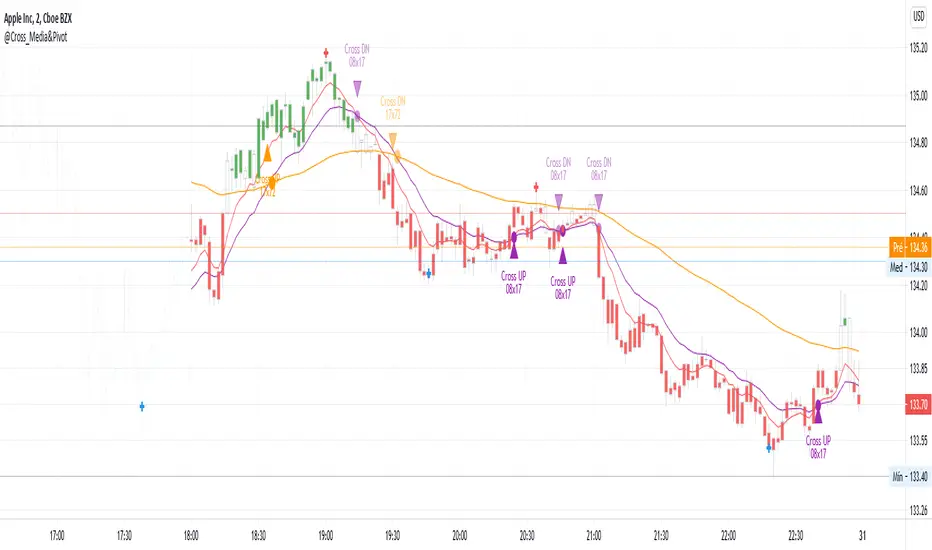
This script uses the functions plot(), cross(), plotcandle(), pivothigh() and pivotllow(). You can see the candles in the color green, above EMA 72 (Exponetional Move Average), and the color red, below EMA72. You can identify the position of the crossing UP and DOWN of the EMA 08 x EMA 17, EMA 17 x EMA72. You can identify the TRADE ENTRY points with the pivot high and TRADE EXIT with the pivot Low.
開源腳本
秉持TradingView一貫精神,這個腳本的創作者將其設為開源,以便交易者檢視並驗證其功能。向作者致敬!您可以免費使用此腳本,但請注意,重新發佈代碼需遵守我們的社群規範。
免責聲明
這些資訊和出版物並非旨在提供,也不構成TradingView提供或認可的任何形式的財務、投資、交易或其他類型的建議或推薦。請閱讀使用條款以了解更多資訊。
開源腳本
秉持TradingView一貫精神,這個腳本的創作者將其設為開源,以便交易者檢視並驗證其功能。向作者致敬!您可以免費使用此腳本,但請注意,重新發佈代碼需遵守我們的社群規範。
免責聲明
這些資訊和出版物並非旨在提供,也不構成TradingView提供或認可的任何形式的財務、投資、交易或其他類型的建議或推薦。請閱讀使用條款以了解更多資訊。