OPEN-SOURCE SCRIPT
Combined Futures Open Interest [Sam SDF-Solutions]
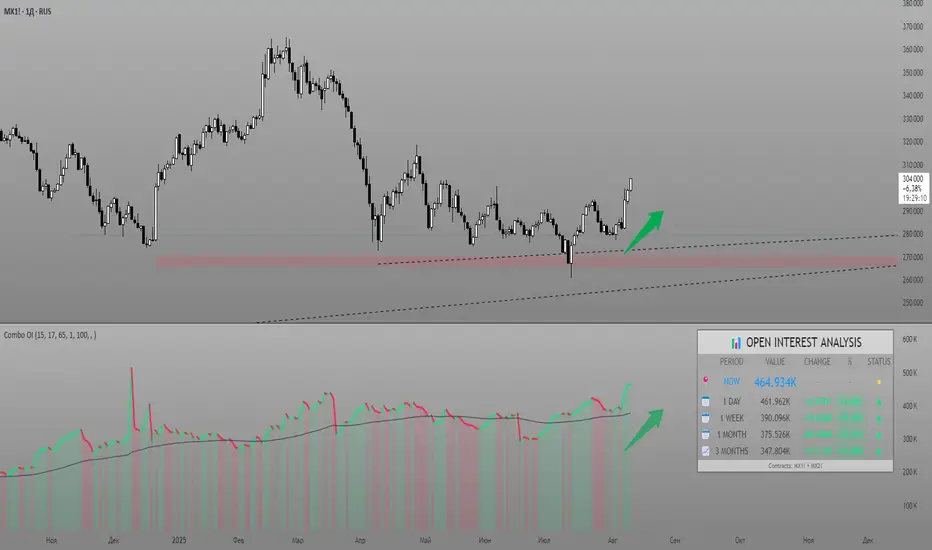
The Combined Futures Open Interest indicator is designed to provide comprehensive analysis of market positioning by aggregating open interest data from the two nearest futures contracts. This dual-contract approach captures the complete picture of market participation, including rollover dynamics between front and back month contracts, offering traders crucial insights into institutional positioning and market sentiment.
Key Features:
Dual-Contract Aggregation: Automatically identifies and combines open interest from the first and second nearest futures contracts (e.g., ES1! + ES2!), providing a complete view of market positioning that single-contract analysis might miss.
Multi-Period Analysis: Tracks open interest changes across multiple timeframes:
Smart Data Handling: Utilizes last known values when data is temporarily unavailable, preventing false signals from data gaps while clearly indicating when stale data is being used.
EMA Smoothing: Incorporates a customizable Exponential Moving Average (default 65 periods) to identify the underlying trend in open interest, filtering out daily noise and highlighting significant deviations.
Dynamic Visualization:
Comprehensive Information Table: Displays real-time statistics including:
Alert System: Configurable alerts for:
How It Works:
___________________
This indicator is essential for futures traders, particularly those focused on index futures, commodities, or currency futures where understanding the aggregate positioning across nearby contracts is crucial. It's especially valuable during rollover periods when positions shift between contracts, and for identifying institutional accumulation or distribution patterns that single-contract analysis might miss. By combining multiple timeframe analysis with intelligent data handling and clear visualization, it simplifies the complex task of monitoring open interest dynamics across the futures curve.
Key Features:
Dual-Contract Aggregation: Automatically identifies and combines open interest from the first and second nearest futures contracts (e.g., ES1! + ES2!), providing a complete view of market positioning that single-contract analysis might miss.
Multi-Period Analysis: Tracks open interest changes across multiple timeframes:
- 1 Day: Immediate market sentiment shifts
- 1 Week: Short-term positioning trends
- 1 Month: Medium-term institutional flows
- 3 Months: Quarterly positioning aligned with contract expiration cycles
Smart Data Handling: Utilizes last known values when data is temporarily unavailable, preventing false signals from data gaps while clearly indicating when stale data is being used.
EMA Smoothing: Incorporates a customizable Exponential Moving Average (default 65 periods) to identify the underlying trend in open interest, filtering out daily noise and highlighting significant deviations.
Dynamic Visualization:
- Color-coded main line showing directional changes (green for increases, red for decreases)
- Optional fill areas between OI and EMA to visualize momentum
- Separate contract lines for detailed rollover analysis
- Customizable labels for significant percentage changes
Comprehensive Information Table: Displays real-time statistics including:
- Current total open interest across both contracts
- Period-over-period changes in absolute and percentage terms
- EMA deviation metrics
- Visual status indicators for quick assessment
- Contract symbols and data quality warnings
Alert System: Configurable alerts for:
- Significant daily changes (customizable threshold)
- EMA crossovers indicating trend changes
- Large percentage movements suggesting institutional activity
How It Works:
- Contract Detection: The indicator automatically identifies the base futures symbol and constructs the appropriate contract codes for the two nearest expirations, or accepts manual symbol input for non-standard contracts.
- Data Aggregation: Open interest data from both contracts is retrieved and summed, providing a complete picture that accounts for positions rolling between contracts.
- Historical Comparison: The indicator calculates changes from multiple lookback periods (1/5/22/66 days) to show how positioning has evolved across different time horizons.
- Trend Analysis: The EMA overlay helps identify whether current open interest is above or below its smoothed average, indicating momentum in position building or reduction.
- Visual Feedback: The main line changes color based on daily changes, while the optional table provides detailed numerical analysis for traders requiring precise data.
___________________
This indicator is essential for futures traders, particularly those focused on index futures, commodities, or currency futures where understanding the aggregate positioning across nearby contracts is crucial. It's especially valuable during rollover periods when positions shift between contracts, and for identifying institutional accumulation or distribution patterns that single-contract analysis might miss. By combining multiple timeframe analysis with intelligent data handling and clear visualization, it simplifies the complex task of monitoring open interest dynamics across the futures curve.
開源腳本
秉持TradingView一貫精神,這個腳本的創作者將其設為開源,以便交易者檢視並驗證其功能。向作者致敬!您可以免費使用此腳本,但請注意,重新發佈代碼需遵守我們的社群規範。
Семен, эксперт инвестиционного клуба "SDF Solutions"
免責聲明
這些資訊和出版物並非旨在提供,也不構成TradingView提供或認可的任何形式的財務、投資、交易或其他類型的建議或推薦。請閱讀使用條款以了解更多資訊。
開源腳本
秉持TradingView一貫精神,這個腳本的創作者將其設為開源,以便交易者檢視並驗證其功能。向作者致敬!您可以免費使用此腳本,但請注意,重新發佈代碼需遵守我們的社群規範。
Семен, эксперт инвестиционного клуба "SDF Solutions"
免責聲明
這些資訊和出版物並非旨在提供,也不構成TradingView提供或認可的任何形式的財務、投資、交易或其他類型的建議或推薦。請閱讀使用條款以了解更多資訊。