OPEN-SOURCE SCRIPT
Strat Magnitude Lines
Have you ever wished you could easily see the daily magnitude line of a Strat Combo while on a smaller timeframe intraday chart? This indicator allows you to do that and much more!
Description
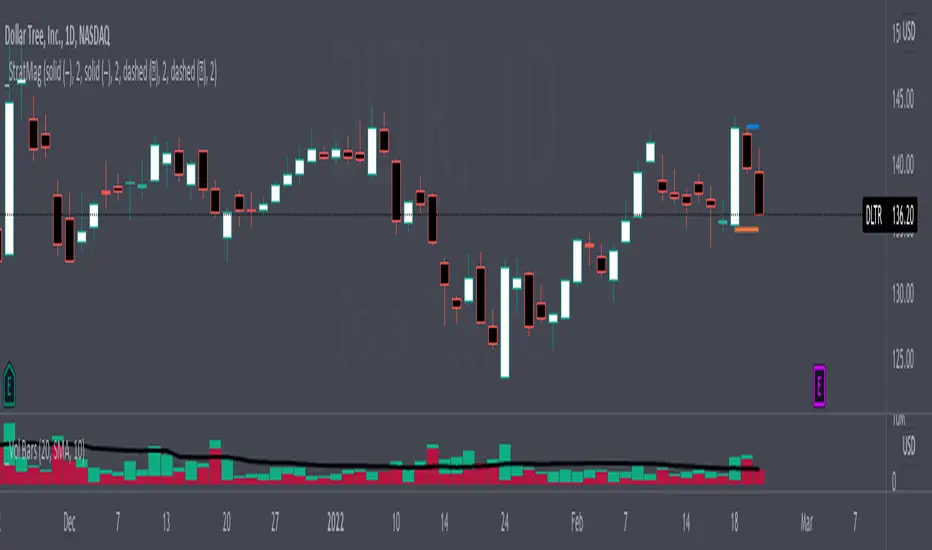
This indicator does two simple things, but it does them very well. The first thing it does is draw a small horizontal line at the magnitude level of a Strat Setup (a potential Strat Combo before the last candle has formed) on the daily chart. This is intended to help the user easy ascertain how much magnitude distance (distance between trigger line and magnitude line) of a potential Strat Combo the night before when the user is searching for trades to play the next trading day. If the last two candles on a daily chart form the first two bars of a Strat Combo, then this indicator display a horizontal line where the ultimate magnitude would be if the next trading day a Strat Combo was formed. This helps the trader gauge whether there is sufficient magnitude that makes it worth it to even consider trading the next day.
The second and most important thing this indicator does is display the daily magnitude line while the user is in a smaller timeframe managing their trade. This helps the user have an easily identifiable line to show where to take full or partial profit at. There is no need to keep track of manually drawn lines or the hassle of letting your charts get cluttered with lines that the user forgot to delete. This indicator finds potential Strat Combos (aka Strat Setups) and dynamically draws horizontal lines for the user and removes them when they are no longer in use. The user can focus on taking profit and making money and leave the hassle to the indicator.
Inputs & Style
All four lines (two daily lines and two intraday lines) can be independently configured. Each lines color, line style, and width can be adjusted. To turn “off” a line change the opacity to 0%.
Automatic daily magnitude line on intraday chart

Description
This indicator does two simple things, but it does them very well. The first thing it does is draw a small horizontal line at the magnitude level of a Strat Setup (a potential Strat Combo before the last candle has formed) on the daily chart. This is intended to help the user easy ascertain how much magnitude distance (distance between trigger line and magnitude line) of a potential Strat Combo the night before when the user is searching for trades to play the next trading day. If the last two candles on a daily chart form the first two bars of a Strat Combo, then this indicator display a horizontal line where the ultimate magnitude would be if the next trading day a Strat Combo was formed. This helps the trader gauge whether there is sufficient magnitude that makes it worth it to even consider trading the next day.
The second and most important thing this indicator does is display the daily magnitude line while the user is in a smaller timeframe managing their trade. This helps the user have an easily identifiable line to show where to take full or partial profit at. There is no need to keep track of manually drawn lines or the hassle of letting your charts get cluttered with lines that the user forgot to delete. This indicator finds potential Strat Combos (aka Strat Setups) and dynamically draws horizontal lines for the user and removes them when they are no longer in use. The user can focus on taking profit and making money and leave the hassle to the indicator.
Inputs & Style
All four lines (two daily lines and two intraday lines) can be independently configured. Each lines color, line style, and width can be adjusted. To turn “off” a line change the opacity to 0%.
Automatic daily magnitude line on intraday chart
開源腳本
秉持TradingView一貫精神,這個腳本的創作者將其設為開源,以便交易者檢視並驗證其功能。向作者致敬!您可以免費使用此腳本,但請注意,重新發佈代碼需遵守我們的社群規範。
免責聲明
這些資訊和出版物並非旨在提供,也不構成TradingView提供或認可的任何形式的財務、投資、交易或其他類型的建議或推薦。請閱讀使用條款以了解更多資訊。
開源腳本
秉持TradingView一貫精神,這個腳本的創作者將其設為開源,以便交易者檢視並驗證其功能。向作者致敬!您可以免費使用此腳本,但請注意,重新發佈代碼需遵守我們的社群規範。
免責聲明
這些資訊和出版物並非旨在提供,也不構成TradingView提供或認可的任何形式的財務、投資、交易或其他類型的建議或推薦。請閱讀使用條款以了解更多資訊。