OPEN-SOURCE SCRIPT
已更新 Day Zero Fakeout Detector MTF
Day Zero Template (Stacey Burke)
Definition:
“Day Zero” is essentially the setup day in Stacey Burke’s playbook.
It’s the day when the market creates a significant inflection — often forming a Peak Formation High (PFH) or Peak Formation Low (PFL).
It usually occurs after 3 days of directional movement (the classic 3-day cycle Stacey teaches).
Example:
Day 1: Breakout expansion.
Day 2: Continuation or consolidation.
Day 3: Exhaustion + reversal (forms PFH/PFL).
Day Zero: The day after this reversal template begins — where traders start looking for measured moves back inside the range.
👉 Day Zero = the transition day where the new weekly cycle (up or down) begins.
2️⃣ Peak Formation Highs (PFH) and Lows (PFL)
A PFH occurs when the market fails above prior highs (often with stop hunts/fakeouts).
A PFL occurs when the market fails below prior lows.
These PFHs/PFLs mark the anchor points for the next 3-day cycle.
Once identified, they become reference levels:
Above PFH → fade long traps (short bias).
Below PFL → fade short traps (long bias).
👉 This is where rectangles (Peter Brandt style) can come in handy to box in the PFH/PFL area.
3️⃣ Peter L. Brandt – Rectangles & Classical Charting
Peter Brandt’s approach (classical charting) complements Stacey’s playbook:
Rectangles are consolidation zones (value areas).
When a PFH or PFL forms, price often consolidates in a rectangle range.
A breakout from that rectangle confirms direction (continuation or reversal).
The measured move target is typically the height of the rectangle projected from the breakout point.
👉 Applied to Day Zero:
PFH/PFL = the extreme boundary of the rectangle.
A breakout from the rectangle in the opposite direction = confirmation of Day Zero reversal.
4️⃣ How They Fit Together
Stacey Burke: Focus on intraday cycles, 3-day cycle, Day Zero as the reset after PFH/PFL.
Peter Brandt: Focus on classical rectangle consolidation and breakout targets.
Integration:
Day Zero = when you’ve spotted a PFH or PFL and are preparing for the new cycle to begin.
Mark the PFH/PFL → draw a rectangle around the consolidation.
Wait for breakout/acceptance beyond rectangle → trade toward measured move (often aligning with Stacey’s Day 1/Day 2 directional bias).
✅ Example in practice:
Monday & Tuesday rally → Wednesday exhaustion → PFH forms.
Thursday = Day Zero (new short bias starting).
Rectangle consolidation forms under PFH.
Breakout below rectangle = signal.
Target = rectangle height measured down → often aligns with yesterday’s lows or prior session value area.
發行說明
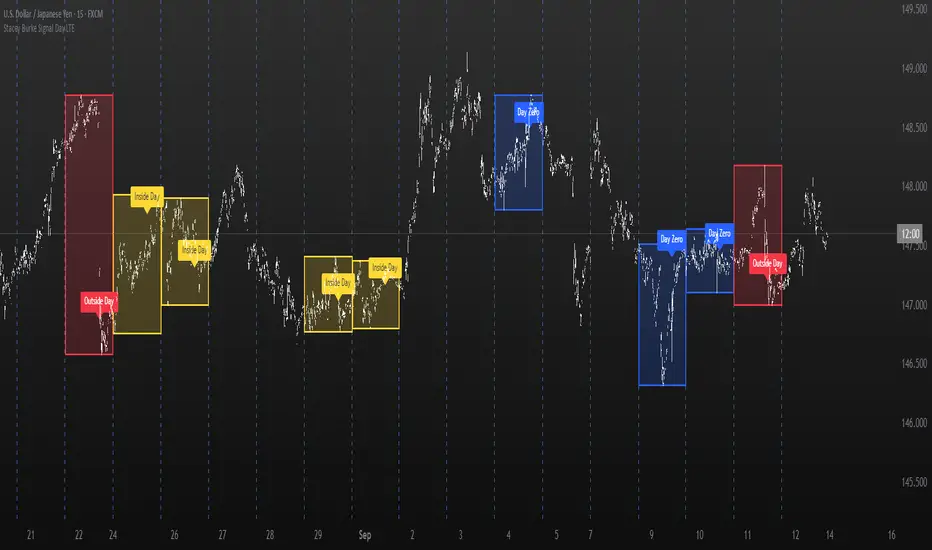
Stacey Burke Signal Day LTEAutomatic detection of Day Zero, Inside Days, and Outside Days for Stacey Burke’s intraday playbook
🔎 Stacey Burke’s Signal Days
This indicator highlights the key daily patterns that often lead to high-probability intraday setups in Stacey Burke’s methodology:
1️⃣ Day Zero
The reset days within a 3-day cycle (e.g. breakout → continuation → exhaustion/reversal).
Can mark the beginning of a new directional phase.
Trades back inside the prior range after a Peak Formation High (PFH) or Peak Formation Low (PFL).
Bias: Look for measured parabolic session moves. When combined with trend following indicators, these signal days can be very powerful.
2️⃣ Inside Day
A day where the entire range is contained within the prior day’s range.
Signals consolidation and energy build-up.
Often leads to explosive breakouts in the next session.
Bias: Trade breakouts of the inside day’s high/low or breakout reversal in the session at key timings in the direction of higher timeframe bias. When combined with trend following indicators, these signal days can be very powerful.
3️⃣ Outside Day (Engulfing Day)
`
A day where the range is larger than the prior day’s range, engulfing both high and low.
Marks trapped traders and fakeouts on both sides.
Often precedes strong continuations or sharp reversals from outside of the ranges.
Bias: Align trades with the true continuation move. When combined with trend following indicators, these signal days can be very powerful.
📌 How They Work Together
Day Zero → Signals the new cycle after PFH/PFL.
Inside Day → Signals compression → expect breakout setups.
Outside Day → Signals exhaustion/fakeouts → expect reversals or continuations.
Together, they give traders a clear daily roadmap for where liquidity sits and when to expect the highest-probability setups.
✅ Example in Practice
Market rallies for 3 days → PFH forms → Day Zero short bias.
Next day prints an Inside Day → watch for breakout continuation short, and breakout reversals.
Later, an Outside Day traps both longs and shorts → the following session offers a clean intraday reversal or continuation trade in line with the underlying MTF trend/bias.
⚙️ Features of This Indicator
Automatic detection of Day Zero, Inside Days, and Outside Days
Multi-Timeframe (MTF) support for cycle alignment
Visual markers for PFH/PFL and consolidation zones
Measured move projections for breakout targets
👉 Stacey Burke Signal Day LTE gives traders just a few of the most important signal days — Day Zero, Inside Day, and Outside Day — to structure their intraday trades around fake outs, breakouts, and reversals within the daily cycles of the week. (This is work in progress: Next up, FRD/FGD's, 3-day cycle detecting, 3DLs, 3DSs).
發行說明
Added new chart to show ticker and timeframe.開源腳本
本著TradingView的真正精神,此腳本的創建者將其開源,以便交易者可以查看和驗證其功能。向作者致敬!雖然您可以免費使用它,但請記住,重新發佈程式碼必須遵守我們的網站規則。
** Please LIKE 👍, FOLLOW ✅, SHARE 🙌 and COMMENT ✍ if you enjoy this idea!
Follow me at FXStreet: fxstreet.com/author/ross-j-burland
Come on over to my YouTube channel and Level Up your trading! 💸💸💸💸💸 @RJBforex, Like and Subscribe!
Follow me at FXStreet: fxstreet.com/author/ross-j-burland
Come on over to my YouTube channel and Level Up your trading! 💸💸💸💸💸 @RJBforex, Like and Subscribe!
免責聲明
這些資訊和出版物並不意味著也不構成TradingView提供或認可的金融、投資、交易或其他類型的意見或建議。請在使用條款閱讀更多資訊。
開源腳本
本著TradingView的真正精神,此腳本的創建者將其開源,以便交易者可以查看和驗證其功能。向作者致敬!雖然您可以免費使用它,但請記住,重新發佈程式碼必須遵守我們的網站規則。
** Please LIKE 👍, FOLLOW ✅, SHARE 🙌 and COMMENT ✍ if you enjoy this idea!
Follow me at FXStreet: fxstreet.com/author/ross-j-burland
Come on over to my YouTube channel and Level Up your trading! 💸💸💸💸💸 @RJBforex, Like and Subscribe!
Follow me at FXStreet: fxstreet.com/author/ross-j-burland
Come on over to my YouTube channel and Level Up your trading! 💸💸💸💸💸 @RJBforex, Like and Subscribe!
免責聲明
這些資訊和出版物並不意味著也不構成TradingView提供或認可的金融、投資、交易或其他類型的意見或建議。請在使用條款閱讀更多資訊。