OPEN-SOURCE SCRIPT
已更新 ICT Smart Money Zones - Sessions & Macros
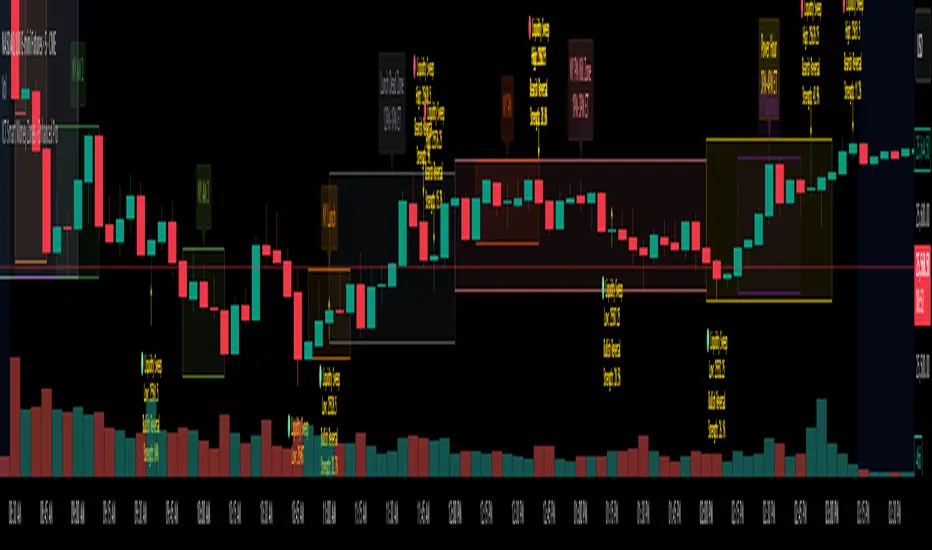
The script helps traders identify high-probability trading times by automatically plotting:
Major market sessions (Asian, London, New York)
ICT Kill Zones (Asian Range, London KZ, New York AM/PM, Lunch Dead Zone, Power Hour)
Opening Ranges (5-min, 15-min, 30-min)
London & New York Macro phases (pre-defined institutional timing windows)
It combines visual session overlays, macro labels, and a timeline bar that dynamically adjusts for Daylight Savings Time (DST) and user time zone preferences.
⚙️ Main Features
🕓 Time Zone Control
Time Zone Modes:
UTC
Session Local Time
Your Time Zone (custom)
Dynamically calculates DST changes for London and New York markets.
Converts session times based on your selected mode.
🌎 Major Market Sessions
Displayed as soft-colored background zones:
Asian Session: 7 PM – 4 AM ET (purple)
London Session: 3 AM – 12 PM ET (blue)
New York Session: 9:30 AM – 4 PM ET (green)
These create context for when liquidity and volatility shift between sessions.
⚡ ICT Kill Zones
Kill zones are the “smart money” time windows where liquidity sweeps and reversals often occur:
Zone Time (ET) Color Purpose
Asian Range 7 PM – 12 AM Red Establishes range / accumulation
London KZ 2 AM – 5 AM Cyan Early volatility & sweep setups
NY Open KZ 7 AM – 10 AM Lime Primary NY session move
Lunch Dead Zone 12 PM – 1 PM Gray Low volume / avoid trading
NY PM KZ 1 PM – 3 PM Orange Reversal or continuation
Power Hour 3 PM – 4 PM Gold Final hour volatility burst
Each is drawn as a translucent box, with automatic high-low range boxes and labels via the LowHighSessionDetector() function.
🏛️ ICT Macros
Institutional “macro” timing blocks used by ICT traders:
London Macros: Two separate sub-sessions (LDN 1, LDN 2)
New York Macros: AM 1–3, Lunch, PM, Last Hour
Each phase is color-coded and labeled with optional start–end times displayed in your chosen time zone.
📈 Opening Ranges
Helps visualize early volatility:
5-min Opening Range (9:30–9:35 ET) – Red
15-min Range (9:30–9:45 ET) – Orange
30-min Range (9:30–10:00 ET) – Violet
Used to measure breakout behavior and morning session direction.
🧮 Technical Architecture
DST_Detector() – Determines when daylight saving time is active per region.
Market_TimeZone_Calculator() – Generates session macros in UTC or local time dynamically.
LowHighSessionDetector() – Tracks the high and low within each session and draws labeled boxes.
draw_session() – Handles visual rendering for timeline zones (background layer).
SplitFunction() – Parses string time ranges into human-readable text for labeling.
📊 Visual Layers
The chart layers follow this order:
Major Sessions (background layer)
ICT Kill Zones (mid layer)
Opening Ranges
ICT Macros (top layer)
Each layer can be toggled on/off individually with color customization.
🧩 Customization Options
Toggle on/off for each zone, macro, or session.
Adjustable timeline bar height (3–30 % of chart).
Optional time display next to macro labels.
Selectable color transparency for each zone.
🧭 Intended Use
This indicator is designed for:
ICT traders analyzing session-based liquidity shifts.
Day traders identifying optimal trading windows.
Market structure enthusiasts visualizing time-based volatility zones.
Combining with Fair Value Gaps, Order Blocks, and SMT Divergences for precise entries.
發行說明
added ITC開源腳本
In true TradingView spirit, the creator of this script has made it open-source, so that traders can review and verify its functionality. Kudos to the author! While you can use it for free, remember that republishing the code is subject to our House Rules.
免責聲明
The information and publications are not meant to be, and do not constitute, financial, investment, trading, or other types of advice or recommendations supplied or endorsed by TradingView. Read more in the Terms of Use.
開源腳本
In true TradingView spirit, the creator of this script has made it open-source, so that traders can review and verify its functionality. Kudos to the author! While you can use it for free, remember that republishing the code is subject to our House Rules.
免責聲明
The information and publications are not meant to be, and do not constitute, financial, investment, trading, or other types of advice or recommendations supplied or endorsed by TradingView. Read more in the Terms of Use.