OPEN-SOURCE SCRIPT
已更新 ATR, Chop, Profit Target and Stop Loss Table
The ATR Table indicator is a versatile tool that helps traders visually and quantitatively manage risk, identify market conditions, and set profit targets and stop-loss levels. It is designed to enhance decision-making by incorporating key volatility and chop (market consolidation) signals into a comprehensive table format.
Key Features:
Average True Range (ATR) Calculation: The indicator computes the ATR over a user-defined period (default 14). ATR helps to measure market volatility, providing insights into how much an asset's price typically moves within a given period.
Stop Loss and Profit Target Calculation: You can configure stop-loss and profit target levels using multipliers based on the ATR. This allows dynamic risk management that adjusts to market volatility:
Stop Loss: Defined as a multiple of the ATR to help control losses.
Profit Target: Also based on a multiple of the ATR to lock in gains. The user can specify whether they are trading long or short, and the indicator adjusts the levels accordingly.
Customizable Plot Lines: The indicator can display the Stop Loss and Profit Target levels directly on the chart. Users can toggle these lines on or off and customize their colors.
Chop Signal: The indicator highlights potential consolidation periods (chop) using a wick-based analysis. It calculates the highest upper or lower wick values and compares them to the ATR to detect periods of indecision or consolidation.
Table Display: When these wick values exceed the ATR by a user-defined multiplier, the corresponding table rows are highlighted.
Background Alerts: Optionally, users can activate background color changes on the chart to visually alert them when chop conditions are detected.
Customizable Table Layout: A table displaying the key values (ATR, Stop Loss, Profit Target, Upper/Lower Wickiness) is placed on the chart. You can choose the table's position, adjust its color scheme, and decide which rows to display.
Chop Background Customization: For users who prefer more visual cues, the indicator allows you to enable or disable background shading when chop conditions are met. You can also choose the color of this background for better customization.
發行說明
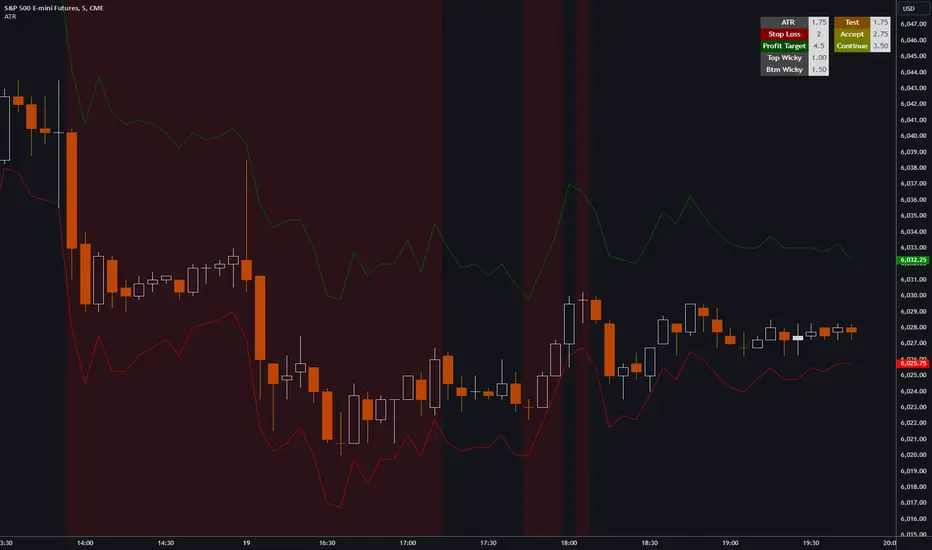
Added new feature to table that tracks values to be used to determine if an active trade will hold over a key support/resistance level and if one should continue to hold to a price target.Test = ATR: Price has touched a key level and is now testing in this range
Accept = Test * 1.5: Price has tested a key level and moved away from the key level by this value indicating that participants may have accepted price beyond the key level
Continue = Test * 2: Price has tested a key level and moved away from the key level by this value indicating that price has a higher probability of continuing to the next key level of support/resistance
發行說明
Updated chart image to better align with publishing guidelines including full symbol information and indicator name visible.開源腳本
秉持TradingView一貫精神,這個腳本的創作者將其設為開源,以便交易者檢視並驗證其功能。向作者致敬!您可以免費使用此腳本,但請注意,重新發佈代碼需遵守我們的社群規範。
免責聲明
這些資訊和出版物並非旨在提供,也不構成TradingView提供或認可的任何形式的財務、投資、交易或其他類型的建議或推薦。請閱讀使用條款以了解更多資訊。
開源腳本
秉持TradingView一貫精神,這個腳本的創作者將其設為開源,以便交易者檢視並驗證其功能。向作者致敬!您可以免費使用此腳本,但請注意,重新發佈代碼需遵守我們的社群規範。
免責聲明
這些資訊和出版物並非旨在提供,也不構成TradingView提供或認可的任何形式的財務、投資、交易或其他類型的建議或推薦。請閱讀使用條款以了解更多資訊。