OPEN-SOURCE SCRIPT
已更新 Analytics Trading Dashboard

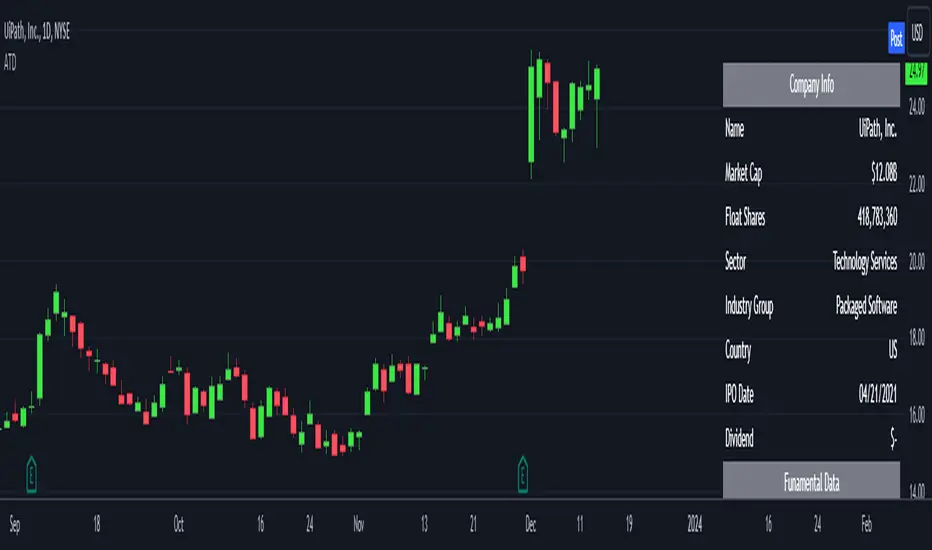
The Analytics Trading Dashboard is a tool designed to bring key information about a company into an easy-to-view dashboard. The indicator combines Company Info, Fundamental Data, Price & Volume Data, and Analyst Recommendations all into one table.
Let’s dive into the details by section:
Company Info:
Fundamental Data:
Price and Volume Data:
Analyst Ratings:
The Analytics Trading Dashboard also comes with the flexibility to select your preferred moving average for price and volume analysis, as well as to choose the specific lookback period for calculating the Average True Range (ATR), Average Daily Range (ADR), and Pocket Pivots lookback period.
Let’s dive into the details by section:
Company Info:
- Name – Company name.
- Market Cap – Total dollar market value of the company’s outstanding shares of stock.
- Float Shares / Shares Outstanding – Floating shares indicate the number of shares available for trading. Outstanding shares are any shares held by shareholders and company insiders.
- Sector – The stock's sector.
- Industry Group - The industry group the stock belongs to.
- IPO Date – Date on which a security is first publicly traded.
- Dividend – The latest dividend amount if the company pays one.
Fundamental Data:
- EPS Due – The date the company is set to report earnings next.
- EPS Est Next Qtr – The earnings per share estimate for the upcoming report.
- EPS Est % Chg (Current Qtr) – The earnings growth as a percentage based on the reported earnings of the same quarter from the previous year.
- EPS % Chg (Last Qtr) – The earnings growth of the last reported quarter as a percentage versus the same quarter from the previous year.
- Last Qtr EPS Surprise – The amount reported earnings beat or missed estimates from the last reported quarter.
- Last 3 Qtrs Avg. EPS Growth – The average percentage growth of the last 3 earnings reports.
- # Qtrs of EPS Acceleration – The number of consecutive quarters that EPS has increased.
- Last 3 Qtrs Avg. Rev Growth – The average percentage growth of the last 3 revenue numbers reported.
- # Qtrs of Rev Acceleration – The number of consecutive quarters that revenue has increased.
- Gross Margin – Measures gross profit compared to revenue as a percentage.
- Debt/Equity Ratio – The ratio of debt to equity, or financial leverage.
Price and Volume Data:
- 52 Week High – The highest high of the last 52 weeks.
- % Off 52 Week High – The percentage the current price has decreased from the 52-week high.
- Price vs. Moving Average – The distance as a percentage that the current price is from the selected moving average.
- Average Volume – The average number of shares traded based on the selected lookback period.
- Average $ Volume – The average of the total value of shares traded based on the selected lookback period.
- Pocket Pivots – The number of pocket pivots that have occurred in the selected lookback period.
- Up/Down Volume Ratio - A 50-day ratio derived by dividing total volume on up days by the total volume on down days.
- ATR – The average true range shown as a dollar value and percentage of current price.
- ADR – The average daily range shown as a dollar value and percentage of current price.
- Beta - Beta is a measure of its volatility relative to the overall market, indicating how much the stock's price is expected to fluctuate compared to the market average.
Analyst Ratings:
- Strong Buy – The number of strong buy recommendations.
- Buy – The number of buy recommendations.
- Hold – The number of hold recommendations.
- Sell – The number of sell recommendations.
- Strong Sell – The number of strong sell recommendations.
The Analytics Trading Dashboard also comes with the flexibility to select your preferred moving average for price and volume analysis, as well as to choose the specific lookback period for calculating the Average True Range (ATR), Average Daily Range (ADR), and Pocket Pivots lookback period.
發行說明
Fixed a typo in the 'Fundamental Data' 發行說明
Update to fix 52 week highs, for newer IPO's with less than 52 weeks of trading 發行說明
Fixed a type and updated ADR calculation發行說明
typo fix in adr display開源腳本
秉持TradingView一貫精神,這個腳本的創作者將其設為開源,以便交易者檢視並驗證其功能。向作者致敬!您可以免費使用此腳本,但請注意,重新發佈代碼需遵守我們的社群規範。
Trusted Pine programmer. Send me a message for script development.
免責聲明
這些資訊和出版物並非旨在提供,也不構成TradingView提供或認可的任何形式的財務、投資、交易或其他類型的建議或推薦。請閱讀使用條款以了解更多資訊。
開源腳本
秉持TradingView一貫精神,這個腳本的創作者將其設為開源,以便交易者檢視並驗證其功能。向作者致敬!您可以免費使用此腳本,但請注意,重新發佈代碼需遵守我們的社群規範。
Trusted Pine programmer. Send me a message for script development.
免責聲明
這些資訊和出版物並非旨在提供,也不構成TradingView提供或認可的任何形式的財務、投資、交易或其他類型的建議或推薦。請閱讀使用條款以了解更多資訊。