OPEN-SOURCE SCRIPT
已更新 Gaussian Channel [DW]

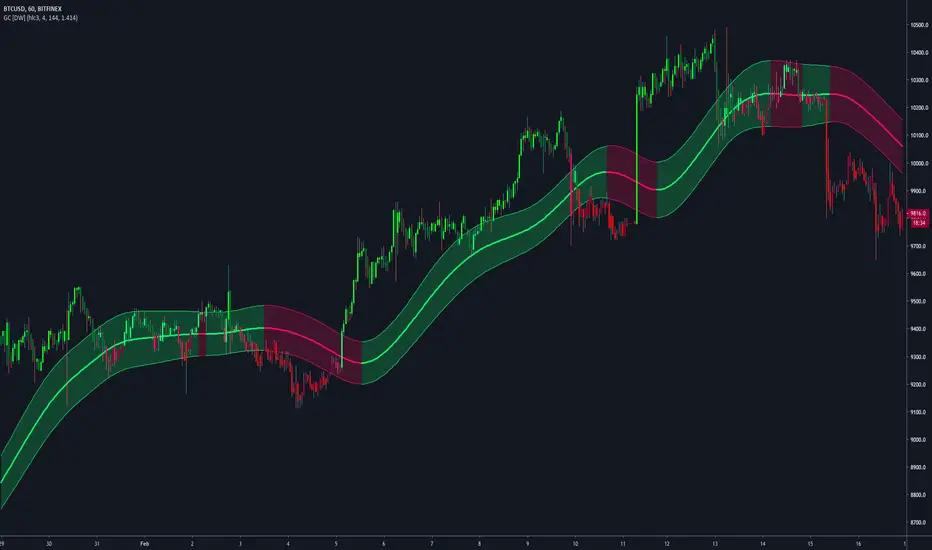
This study is an experiment utilizing the Ehlers Gaussian Filter technique combined with lag reduction techniques and true range to analyze trend activity.
Gaussian filters, as Ehlers explains it, are simply exponential moving averages applied multiple times.
First, beta and alpha are calculated based on the sampling period and number of poles specified. The maximum number of poles available in this script is 9.
Next, the data being analyzed is given a truncation option for reduced lag, which can be enabled with "Reduced Lag Mode".
Then the alpha and source values are used to calculate the filter and filtered true range of the dataset.
Filtered true range with a specified multiplier is then added to and subtracted from the filter, generating a channel.
Lastly, a one pole filter with a N pole alpha is averaged with the filter to generate a faster filter, which can be enabled with "Fast Response Mode".
Custom bar colors are included.
Note: Both the sampling period and number of poles directly affect how much lag the indicator has, and how smooth the output is.
Larger inputs will result in smoother outputs with increased lag, and smaller inputs will have noisier outputs with reduced lag.
For the best results, I recommend not setting the sampling period any lower than the number of poles + 1. Going lower truncates the equation.
發行說明
Updates:Huge shoutout to @e2e4mfck for taking the time to improve the calculation method!
-> migrated to v4
-> pi is now calculated using trig identities rather than being explicitly defined.
-> The filter calculations are now organized into functions rather than being individually defined.
-> Revamped color scheme.
開源腳本
秉持TradingView一貫精神,這個腳本的創作者將其設為開源,以便交易者檢視並驗證其功能。向作者致敬!您可以免費使用此腳本,但請注意,重新發佈代碼需遵守我們的社群規範。
For my full list of premium tools, check the blog:
wallanalytics.com/
Reach out on Telegram:
t.me/DonovanWall
wallanalytics.com/
Reach out on Telegram:
t.me/DonovanWall
免責聲明
這些資訊和出版物並非旨在提供,也不構成TradingView提供或認可的任何形式的財務、投資、交易或其他類型的建議或推薦。請閱讀使用條款以了解更多資訊。