OPEN-SOURCE SCRIPT
Relative Strength Market Picker
Modified to code from modhelius and added colors and histogram for easy reading...thanks to him...
What is Relative Strength?
Relative strength is a ratio of a stock price performance to a market average (index) performance. It is used in technical analysis.
It is not to be confused with relative strength index.
To calculate the relative strength of a particular stock, divide the percentage change over some time period by the percentage change of a particular index over the same time period.
How to read this indicator for trading and decesion making?
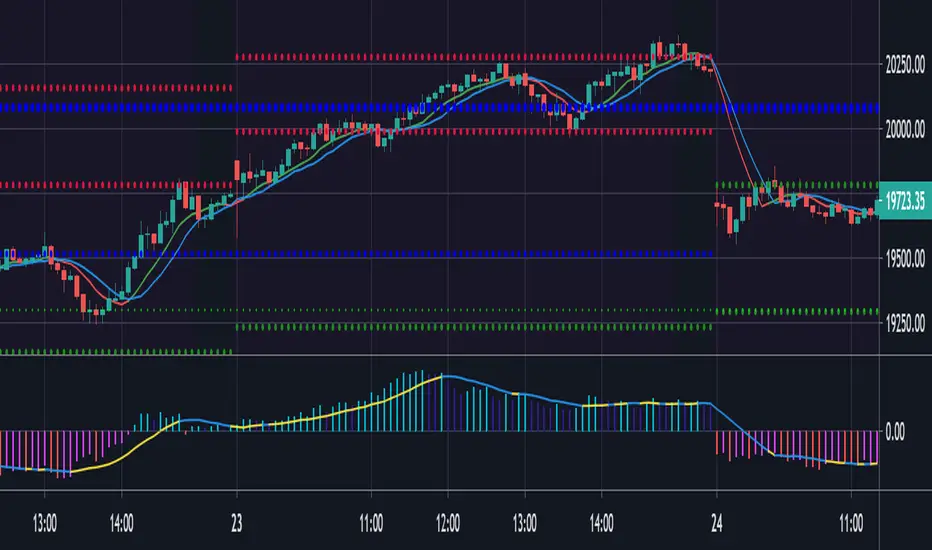
There are four colors
Aqua: Shows the bullish momentum against the index of your choosing
Navy blue: Show the bearish momentum is weakning at the time period
Fuschsia : Shows the bullish gaining strength and about to cross zero line
Red: Shows the bearish momentum is strong.
Other indicators to be used along with this are
1. Pivot points
2. Moving Average of highs and lows -- 17 period
To take long calls --- There has to be high closing candle above the 17 period moving average of highs and there has to be bullish momentum and ideally with the pivot point as a support
To take short calls -- There has to low closing candle below the 17 period moving average of lows and there has to be bearish momentum and ideally with the pivot point as a resistance.


What is Relative Strength?
Relative strength is a ratio of a stock price performance to a market average (index) performance. It is used in technical analysis.
It is not to be confused with relative strength index.
To calculate the relative strength of a particular stock, divide the percentage change over some time period by the percentage change of a particular index over the same time period.
How to read this indicator for trading and decesion making?
There are four colors
Aqua: Shows the bullish momentum against the index of your choosing
Navy blue: Show the bearish momentum is weakning at the time period
Fuschsia : Shows the bullish gaining strength and about to cross zero line
Red: Shows the bearish momentum is strong.
Other indicators to be used along with this are
1. Pivot points
2. Moving Average of highs and lows -- 17 period
To take long calls --- There has to be high closing candle above the 17 period moving average of highs and there has to be bullish momentum and ideally with the pivot point as a support
To take short calls -- There has to low closing candle below the 17 period moving average of lows and there has to be bearish momentum and ideally with the pivot point as a resistance.
開源腳本
秉持TradingView一貫精神,這個腳本的創作者將其設為開源,以便交易者檢視並驗證其功能。向作者致敬!您可以免費使用此腳本,但請注意,重新發佈代碼需遵守我們的社群規範。
免責聲明
這些資訊和出版物並非旨在提供,也不構成TradingView提供或認可的任何形式的財務、投資、交易或其他類型的建議或推薦。請閱讀使用條款以了解更多資訊。
免責聲明
這些資訊和出版物並非旨在提供,也不構成TradingView提供或認可的任何形式的財務、投資、交易或其他類型的建議或推薦。請閱讀使用條款以了解更多資訊。