OPEN-SOURCE SCRIPT
已更新 MOEX Sectors: % Above MA 50/100/200 (EMA/SMA)
🧠 Name:
MOEX Sectors: % Above MA 50/100/200 (EMA/SMA)
📋 Description (for TradingView “Description” tab):
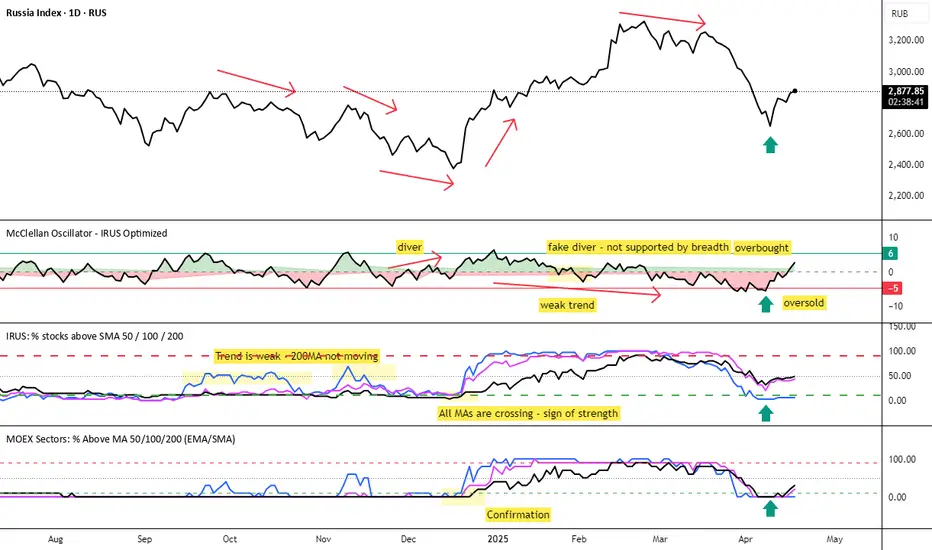
This indicator shows the percentage of Moscow Exchange sectoral indices trading above the selected moving average (SMA or EMA) with periods of 50, 100, or 200.
It uses 10 official MOEX sector indices:
MOEXOG (Oil & Gas)
MOEXCH (Chemicals)
MOEXMM (Metals & Mining)
MOEXTN (Transport)
MOEXCN (Consumer)
MOEXFN (Financials)
MOEXTL (Telecom)
MOEXEU (Utilities)
MOEXIT (IT)
MOEXRE (Real Estate)
The indicator plots up to 3 lines representing the % of sectors trading above MA 50, 100, and/or 200. The MA type is user-selectable: EMA (default) or SMA.
Horizontal reference levels (90, 50, 10) help interpret market conditions:
🔼 >90% — Overbought zone, potential market exhaustion
⚖️ ~50% — Neutral state
🔽 <10% — Oversold zone, possible rebound
📈 How to Use in Strategy:
✅ 1. Trend Filter
If >50% of sectors are above MA 200 → market in long-term uptrend
If <50% → avoid long bias, bearish regime likely
✅ 2. Bottom Detection
When <10% of sectors are above MA 200, the market is heavily oversold — often a bottoming signal
✅ 3. Trend Confirmation
If the main index is rising and % of sectors above MA is growing, the trend is supported by breadth
If the index rises while breadth declines → bearish divergence
✅ 4. Contrarian Setups
>90% of sectors above MA 50 → market may be overheated, watch for pullback
<20% above MA 50 → potential local bottom
⚙️ Tips:
Overlay this indicator on the IMOEX index chart to detect narrow leadership
Combine with other breadth metrics or RSI on the index
Use the EMA/SMA toggle to fine-tune sensitivity
MOEX Sectors: % Above MA 50/100/200 (EMA/SMA)
📋 Description (for TradingView “Description” tab):
This indicator shows the percentage of Moscow Exchange sectoral indices trading above the selected moving average (SMA or EMA) with periods of 50, 100, or 200.
It uses 10 official MOEX sector indices:
MOEXOG (Oil & Gas)
MOEXCH (Chemicals)
MOEXMM (Metals & Mining)
MOEXTN (Transport)
MOEXCN (Consumer)
MOEXFN (Financials)
MOEXTL (Telecom)
MOEXEU (Utilities)
MOEXIT (IT)
MOEXRE (Real Estate)
The indicator plots up to 3 lines representing the % of sectors trading above MA 50, 100, and/or 200. The MA type is user-selectable: EMA (default) or SMA.
Horizontal reference levels (90, 50, 10) help interpret market conditions:
🔼 >90% — Overbought zone, potential market exhaustion
⚖️ ~50% — Neutral state
🔽 <10% — Oversold zone, possible rebound
📈 How to Use in Strategy:
✅ 1. Trend Filter
If >50% of sectors are above MA 200 → market in long-term uptrend
If <50% → avoid long bias, bearish regime likely
✅ 2. Bottom Detection
When <10% of sectors are above MA 200, the market is heavily oversold — often a bottoming signal
✅ 3. Trend Confirmation
If the main index is rising and % of sectors above MA is growing, the trend is supported by breadth
If the index rises while breadth declines → bearish divergence
✅ 4. Contrarian Setups
>90% of sectors above MA 50 → market may be overheated, watch for pullback
<20% above MA 50 → potential local bottom
⚙️ Tips:
Overlay this indicator on the IMOEX index chart to detect narrow leadership
Combine with other breadth metrics or RSI on the index
Use the EMA/SMA toggle to fine-tune sensitivity
發行說明
📝 This indicator tracks market breadth across sector indices of the Moscow Exchange (MOEX). It calculates the percentage of sectors trading above selected moving averages (SMA or EMA) with user-defined periods (50, 100, or 200).It provides a high-level view of market participation and internal strength, helping to identify broad trends, divergences, and potential reversals.
📦 Tracked MOEX Sector Indices:
mathematica
Copy
Edit
MOEXOG — Oil & Gas
MOEXCH — Chemicals
MOEXMM — Metals & Mining
MOEXTN — Transport
MOEXCN — Consumer
MOEXFN — Financials
MOEXTL — Telecom
MOEXEU — Utilities
MOEXIT — Information Technology
MOEXRE — Real Estate
📈 How to Use:
>50% above MA 200 → Bullish market regime
<50% above MA 200 → Weak breadth, caution advised
>90% above MA 50 → Market may be overbought
<10% above MA 200 → Market oversold, possible bottom
Combine with the IMOEX index to assess participation behind major moves
Use as a trend filter or divergence detector
開源腳本
秉持TradingView一貫精神,這個腳本的創作者將其設為開源,以便交易者檢視並驗證其功能。向作者致敬!您可以免費使用此腳本,但請注意,重新發佈代碼需遵守我們的社群規範。
免責聲明
這些資訊和出版物並非旨在提供,也不構成TradingView提供或認可的任何形式的財務、投資、交易或其他類型的建議或推薦。請閱讀使用條款以了解更多資訊。
免責聲明
這些資訊和出版物並非旨在提供,也不構成TradingView提供或認可的任何形式的財務、投資、交易或其他類型的建議或推薦。請閱讀使用條款以了解更多資訊。