OPEN-SOURCE SCRIPT
Turnover
// ========================================
// TURNOVER INDICATOR (成交额指标)
// ========================================
//
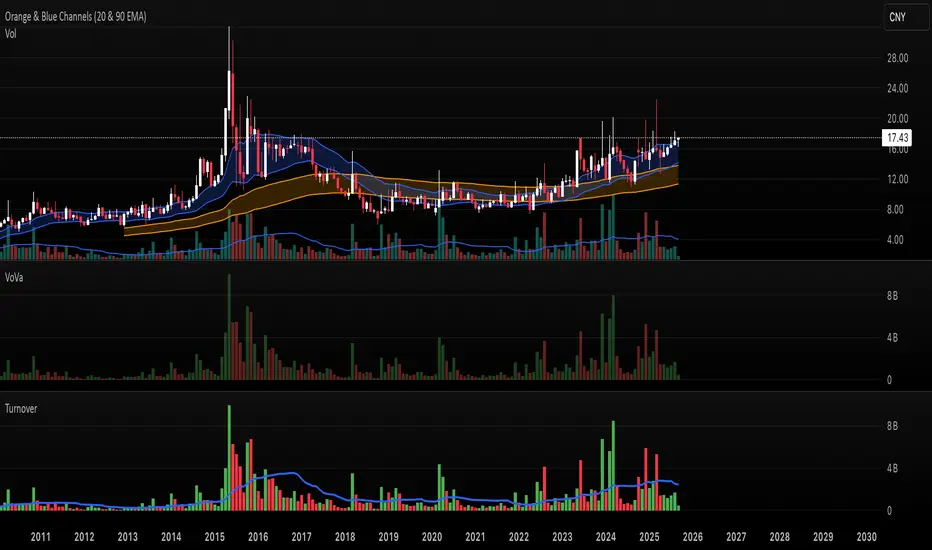
// This indicator calculates and displays the turnover (trading value) for each bar,
// which represents the total monetary value of shares traded during that period.
// Turnover = Volume × Price
//
// KEY FEATURES:
// • Multiple price basis options: VWAP (recommended for intraday) or HLC3 average
// • Visual representation with colored columns (red/green for down/up bars)
// • Moving average overlay to smooth turnover trends
// • Rolling sum calculation for cumulative turnover over specified periods
// • Fully customizable parameters for different trading strategies
//
// USE CASES:
// • Identify periods of high/low market activity and liquidity
// • Analyze institutional money flow and market participation
// • Spot potential breakout or reversal points based on turnover spikes
// • Compare relative trading interest across different timeframes
// • Monitor market strength during trend formations
//
// PARAMETERS:
// • Price Basis: Choose between VWAP (intraday focus) or HLC3 (daily+ timeframes)
// • Visual Options: Toggle MA, rolling sum, and color coding
// • Timeframe Flexibility: Adjust MA and sum periods for your analysis needs
//
// ========================================
// TURNOVER INDICATOR (成交额指标)
// ========================================
//
// This indicator calculates and displays the turnover (trading value) for each bar,
// which represents the total monetary value of shares traded during that period.
// Turnover = Volume × Price
//
// KEY FEATURES:
// • Multiple price basis options: VWAP (recommended for intraday) or HLC3 average
// • Visual representation with colored columns (red/green for down/up bars)
// • Moving average overlay to smooth turnover trends
// • Rolling sum calculation for cumulative turnover over specified periods
// • Fully customizable parameters for different trading strategies
//
// USE CASES:
// • Identify periods of high/low market activity and liquidity
// • Analyze institutional money flow and market participation
// • Spot potential breakout or reversal points based on turnover spikes
// • Compare relative trading interest across different timeframes
// • Monitor market strength during trend formations
//
// PARAMETERS:
// • Price Basis: Choose between VWAP (intraday focus) or HLC3 (daily+ timeframes)
// • Visual Options: Toggle MA, rolling sum, and color coding
// • Timeframe Flexibility: Adjust MA and sum periods for your analysis needs
//
// ========================================
開源腳本
秉持TradingView一貫精神,這個腳本的創作者將其設為開源,以便交易者檢視並驗證其功能。向作者致敬!您可以免費使用此腳本,但請注意,重新發佈代碼需遵守我們的社群規範。
免責聲明
這些資訊和出版物並非旨在提供,也不構成TradingView提供或認可的任何形式的財務、投資、交易或其他類型的建議或推薦。請閱讀使用條款以了解更多資訊。
開源腳本
秉持TradingView一貫精神,這個腳本的創作者將其設為開源,以便交易者檢視並驗證其功能。向作者致敬!您可以免費使用此腳本,但請注意,重新發佈代碼需遵守我們的社群規範。
免責聲明
這些資訊和出版物並非旨在提供,也不構成TradingView提供或認可的任何形式的財務、投資、交易或其他類型的建議或推薦。請閱讀使用條款以了解更多資訊。