OPEN-SOURCE SCRIPT
已更新 Time Window Optimizer [theUltimator5]

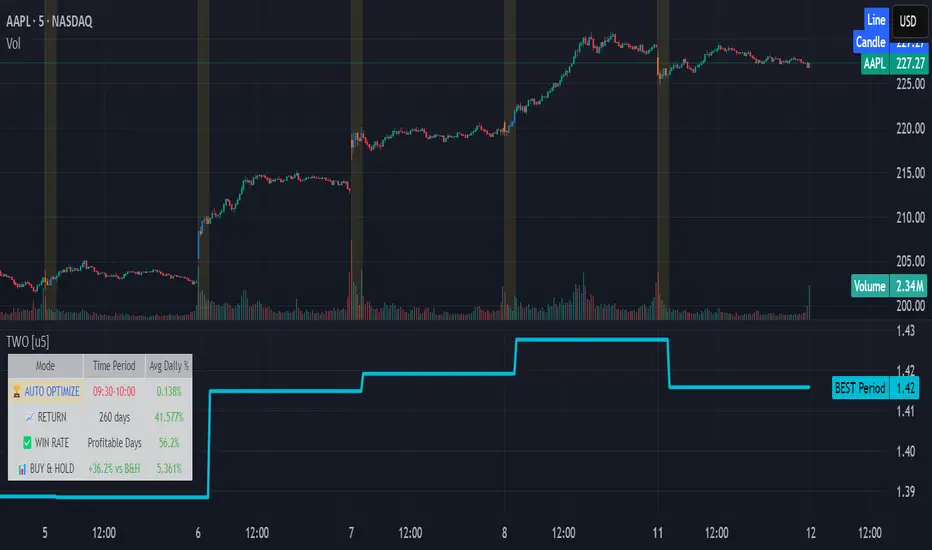
The Time Window Optimizer is designed to identify the most profitable 30-minute trading windows during regular market hours (9:30 AM - 4:00 PM EST). This tool helps traders optimize their intraday strategies by automatically discovering time periods with the highest historical performance or allowing manual selection for custom analysis. It also allows you to select manual timeframes for custom time period analysis.
🏆 Automatic Window Discovery
The core feature of this indicator is its intelligent Auto-Find Best 30min Window system that analyzes all 13 possible 30-minute time slots during market hours.
How the Algorithm Works:
Visual Representation:
📊 Comprehensive Performance Analysis
The indicator provides detailed statistics in an information table:
🛠️ User Settings
https://imgur.com/a/R3QPWfm
Auto-Optimization Controls:
Manual Mode:
https://imgur.com/a/UH9lD3L
Visual Customization:
https://imgur.com/a/4i0pxsQ
*Background Highlighting: Optional background color during active time windows
*Candle Coloring: Custom colors for bullish/bearish candles within the time window
*Table Positioning: Flexible placement of the statistics table anywhere on the chart
🔧 Technical Features
Market Compatibility:
Performance Optimization:
💡 Use Cases
📈 Key Benefits
This indicator transforms complex intraday analysis into actionable insights, helping traders optimize their time allocation and improve overall trading performance through systematic, data-driven approach to market timing.
🏆 Automatic Window Discovery
The core feature of this indicator is its intelligent Auto-Find Best 30min Window system that analyzes all 13 possible 30-minute time slots during market hours.
How the Algorithm Works:
- Concurrent Analysis: The indicator simultaneously tracks performance across all 13 time windows (9:30-10:00, 10:00-10:30, 10:30-11:00... through 15:30-16:00)
- Daily Performance Tracking: For each window, it captures the percentage change from window open to window close on every trading day
- Cumulative Compounding: Daily returns are compounded over time to show the true long-term performance of each window, starting from a normalized value of 1.0
- Dynamic Optimization: The system continuously identifies the window with the highest cumulative return and highlights it as the optimal choice
- Statistical Validation: Performance is validated through multiple metrics including average daily returns, win rates, and total sample size
Visual Representation:
- Best Window Line: The top-performing window is displayed as a thick colored line for easy identification
- All 13 Lines (optional): Users can view performance lines for all time windows simultaneously to compare relative performance
- Smart Coloring: Lines are color-coded (green for gains, red for losses) with the best performer highlighted in a user-selected color
📊 Comprehensive Performance Analysis
The indicator provides detailed statistics in an information table:
- Average Daily Return: Mean percentage change per trading session
- Cumulative Return: Total compounded performance over the analysis period
- Win Rate: Percentage of profitable days (colored green if ≥50%, red if <50%)
- Buy & Hold Comparison: Shows outperformance vs. simple buy-and-hold strategy
- Sample Size: Number of trading days analyzed for statistical significance
🛠️ User Settings
https://imgur.com/a/R3QPWfm
Auto-Optimization Controls:
- Auto-Find Best Window: Toggle to enable/disable automatic optimization
- Show All 13 Lines: Display all time window performance lines simultaneously
- Best Window Line Color: Customize the color of the top-performing window
Manual Mode:
https://imgur.com/a/UH9lD3L
- Custom Time Window: Set any desired time range using session format (HHMM-HHMM)
- Crypto Support: Built-in timezone offset adjustment for cryptocurrency markets
- Chart Type Options: Switch between candlestick and line chart visualization
Visual Customization:
https://imgur.com/a/4i0pxsQ
*Background Highlighting: Optional background color during active time windows
*Candle Coloring: Custom colors for bullish/bearish candles within the time window
*Table Positioning: Flexible placement of the statistics table anywhere on the chart
🔧 Technical Features
Market Compatibility:
- Stock Markets: Optimized for traditional market hours (9:30 AM - 4:00 PM EST)
- Cryptocurrency: Includes timezone offset adjustment for 24/7 crypto markets
- Exchange Detection: Automatically detects crypto exchanges and applies appropriate settings
Performance Optimization:
- Efficient Calculation: Uses separate arrays for each time block to minimize computational overhead
- Real-time Updates: Dynamically updates the best-performing window as new data becomes available
- Memory Management: Optimized data structures to handle large datasets efficiently
💡 Use Cases
- Strategy Development: Identify the most profitable trading hours for your specific instruments
- Risk Management: Focus trading activity during historically successful time periods
- Performance Comparison: Evaluate whether time-specific strategies outperform buy-and-hold
- Market Analysis: Understand intraday patterns and market behavior across different time windows
📈 Key Benefits
- Data-Driven Decisions: Base trading schedules on historical performance data
- Automated Analysis: No manual calculation required - the algorithm does the work
- Flexible Implementation: Works in both automated discovery and manual selection modes
- Comprehensive Metrics: Multiple performance indicators for thorough analysis
- Visual Clarity: Clear, color-coded visualization makes interpretation intuitive
This indicator transforms complex intraday analysis into actionable insights, helping traders optimize their time allocation and improve overall trading performance through systematic, data-driven approach to market timing.
發行說明
Cleaned up some of the commenting and added the indicator name to the chart to abide by house rules.開源腳本
秉持TradingView一貫精神,這個腳本的創作者將其設為開源,以便交易者檢視並驗證其功能。向作者致敬!您可以免費使用此腳本,但請注意,重新發佈代碼需遵守我們的社群規範。
免責聲明
這些資訊和出版物並非旨在提供,也不構成TradingView提供或認可的任何形式的財務、投資、交易或其他類型的建議或推薦。請閱讀使用條款以了解更多資訊。
開源腳本
秉持TradingView一貫精神,這個腳本的創作者將其設為開源,以便交易者檢視並驗證其功能。向作者致敬!您可以免費使用此腳本,但請注意,重新發佈代碼需遵守我們的社群規範。
免責聲明
這些資訊和出版物並非旨在提供,也不構成TradingView提供或認可的任何形式的財務、投資、交易或其他類型的建議或推薦。請閱讀使用條款以了解更多資訊。