PROTECTED SOURCE SCRIPT
Moving Average Touch Points
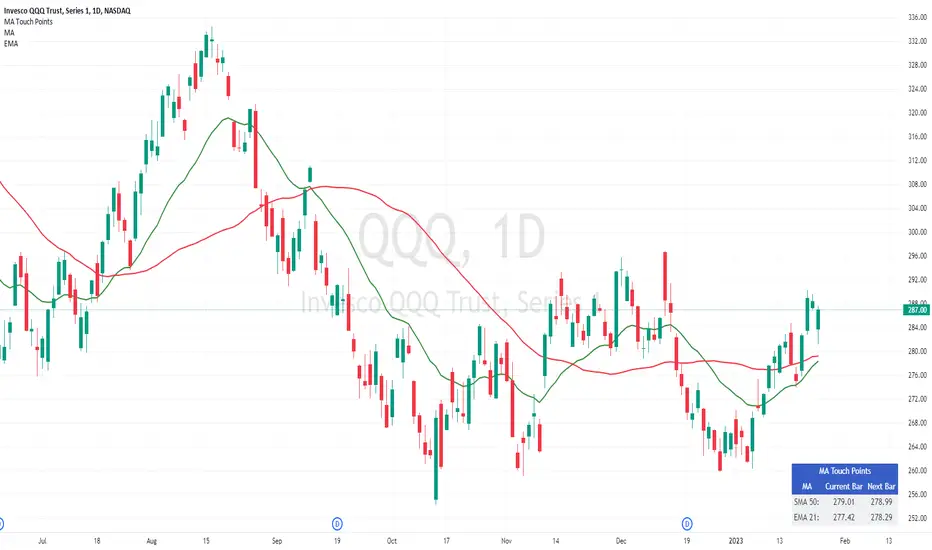
This tool allows you to know at what price a security will touch its moving average today or tomorrow. This may sound simple, but today's action will influence the final value of the average itself, causing it to 'move' during the live session. This is problematic for people trying to use an average to place orders - especially with shorter-term averages. This tool shows the exact point mathematically where the price will equal its average on the current bar and the next bar. This allows you to plan precisely during a live trading session or in the evening for tomorrow's trading session.
The tool works on all time frames for people seeking to use it on intraday or weekly charts.
Acknowledgment
Thank you to @JohnMuchow for coding my formulas.
The tool works on all time frames for people seeking to use it on intraday or weekly charts.
Acknowledgment
Thank you to @JohnMuchow for coding my formulas.
受保護腳本
此腳本以閉源形式發佈。 不過,您可以自由使用,沒有任何限制 — 點擊此處了解更多。
Get access to CarusoInsights indicators: carusoinsights.com/charting/
免責聲明
這些資訊和出版物並非旨在提供,也不構成TradingView提供或認可的任何形式的財務、投資、交易或其他類型的建議或推薦。請閱讀使用條款以了解更多資訊。
受保護腳本
此腳本以閉源形式發佈。 不過,您可以自由使用,沒有任何限制 — 點擊此處了解更多。
Get access to CarusoInsights indicators: carusoinsights.com/charting/
免責聲明
這些資訊和出版物並非旨在提供,也不構成TradingView提供或認可的任何形式的財務、投資、交易或其他類型的建議或推薦。請閱讀使用條款以了解更多資訊。