OPEN-SOURCE SCRIPT
已更新 Volume Pressure
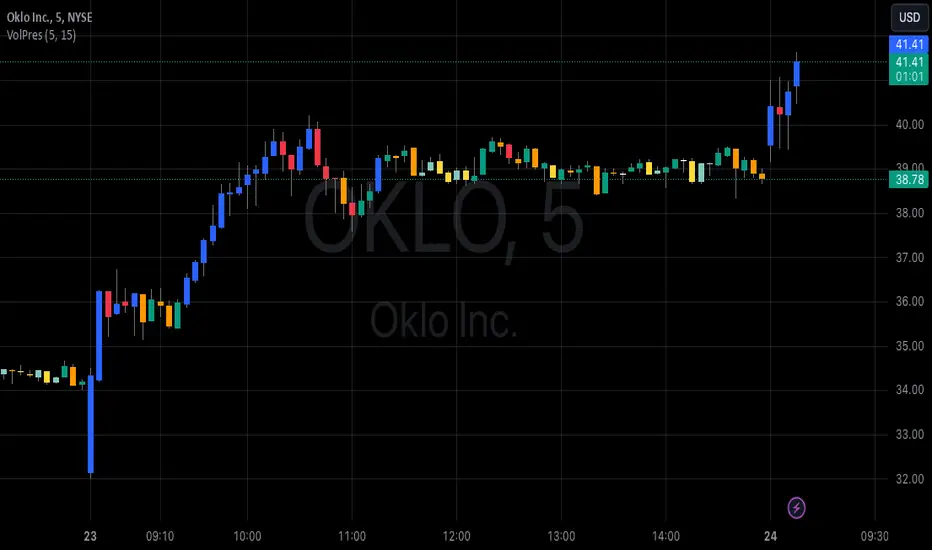
Draws the candle chart with colors to represent low, medium and high volumes. You get 3 colors for downward and 3 colors for upward movement. This will aid with immediately seeing the relative volume pushing the stock candle in the direction of movement.
You can control the percentage threshold for low and high volume. You also can change the colors to represent each volume level for upward and downward movement.
You can control the percentage threshold for low and high volume. You also can change the colors to represent each volume level for upward and downward movement.
發行說明
Draws the candle chart with colors to represent low, medium and high volumes. You get 3 colors for downward and 3 colors for upward movement. This will aid with immediately seeing the relative volume pushing the stock candle in the direction of movement.You can control the percentage threshold for low and high volume. You also can change the colors to represent each volume level for upward and downward movement.
開源腳本
秉持TradingView一貫精神,這個腳本的創作者將其設為開源,以便交易者檢視並驗證其功能。向作者致敬!您可以免費使用此腳本,但請注意,重新發佈代碼需遵守我們的社群規範。
免責聲明
這些資訊和出版物並非旨在提供,也不構成TradingView提供或認可的任何形式的財務、投資、交易或其他類型的建議或推薦。請閱讀使用條款以了解更多資訊。
免責聲明
這些資訊和出版物並非旨在提供,也不構成TradingView提供或認可的任何形式的財務、投資、交易或其他類型的建議或推薦。請閱讀使用條款以了解更多資訊。