OPEN-SOURCE SCRIPT
已更新 ATR
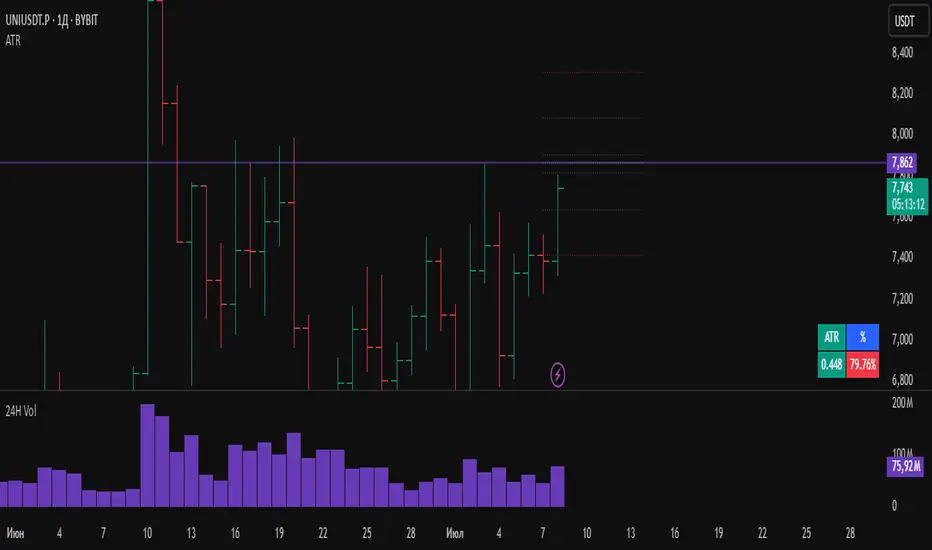
What the Indicator Shows:
A compact table with four cells is displayed in the bottom-left corner of the chart:
| ATR | % | Level | Lvl+ATR |
Explanation of the Columns:
ATR — The averaged daily range (volatility) calculated with filtering of abnormal bars (extremely large or small daily candles are ignored).
% — The percentage of the daily ATR that the price has already covered today (the difference between the daily Open and Close relative to ATR).
Level — A custom user-defined level set through the indicator settings.
Lvl+ATR — The sum of the daily ATR and the user-defined level. This can be used, for example, as a target or stop-loss reference.
Color Highlighting of the "%" Cell:
The background color of the "%" ATR cell changes depending on the value:
✅ If the value is less than 10% — the cell is green (market is calm, small movement).
➖ If the value is between 10% and 50% — no highlighting (average movement, no signal).
🟡 If the value is between 50% and 70% — the cell is yellow (movement is increasing, be alert).
🔴 If the value is above 70% — the cell is red (the market is actively moving, high volatility).
Key Features:
✔ All ATR calculations and percentage progress are performed strictly based on daily data, regardless of the chart's current timeframe.
✔ The indicator is ideal for intraday traders who want to monitor daily volatility levels.
✔ The table always displays up-to-date information for quick decision-making.
✔ Filtering of abnormal bars makes ATR more stable and objective.
What is Adaptive ATR in this Indicator:
Instead of the classic ATR, which simply averages the true range, this indicator uses a custom algorithm:
✅ It analyzes daily bars over the past 100 days.
✅ Calculates the range High - Low for each bar.
✅ If the bar's range deviates too much from the average (more than 1.8 times higher or lower), the bar is considered abnormal and ignored.
✅ Only "normal" bars are included in the calculation.
✅ The average range of these normal bars is the adaptive ATR.
Detailed Algorithm of the getAdaptiveATR() Function:
The function takes the number of bars to include in the calculation (for example, 5):
The average of the last 5 normal bars is calculated.
pinescript
Копировать
Редактировать
adaptiveATR = getAdaptiveATR(5)
Step-by-Step Process:
An empty array ranges is created to store the ranges.
Daily bars with indices from 1 to 100 are iterated over.
For each bar:
🔹 The daily High and Low with the required offset are loaded via request.security().
🔹 The range High - Low is calculated.
🔹 The temporary average range of the current array is calculated.
🔹 The bar is checked for abnormality (too large or too small).
🔹 If the bar is normal or it's the first bar — its range is added to the array.
Once the array accumulates the required number of bars (count), their average is calculated — this is the adaptive ATR.
If it's not possible to accumulate the required number of bars — na is returned.
Что показывает индикатор:
На графике внизу слева отображается компактная таблица из четырех ячеек:
ATR % Уровень Ур+ATR
Пояснения к столбцам:
ATR — усреднённый дневной диапазон (волатильность), рассчитанный с фильтрацией аномальных баров (слишком большие или маленькие дневные свечи игнорируются).
% — процент дневного ATR, который уже "прошла" цена на текущий день (разница между открытием и закрытием относительно ATR).
Уровень — пользовательский уровень, который задаётся вручную через настройки индикатора.
Ур+ATR — сумма уровня и дневного ATR. Может использоваться, например, как ориентир для целей или стопов.
Цветовая подсветка ячейки "%":
Цвет фона ячейки с процентом ATR меняется в зависимости от значения:
✅ Если значение меньше 10% — ячейка зелёная (рынок пока спокоен, маленькое движение).
➖ Если значение от 10% до 50% — фон не подсвечивается (среднее движение, нет сигнала).
🟡 Если значение от 50% до 70% — ячейка жёлтая (движение усиливается, повышенное внимание).
🔴 Если значение выше 70% — ячейка красная (рынок активно движется, высокая волатильность).
Особенности работы:
✔ Все расчёты ATR и процентного прохождения производятся исключительно по дневным данным, независимо от текущего таймфрейма графика.
✔ Индикатор подходит для трейдеров, которые торгуют внутри дня, но хотят ориентироваться на дневные уровни волатильности.
✔ В таблице всегда отображается актуальная информация для принятия быстрых торговых решений.
✔ Фильтрация аномальных баров делает ATR более устойчивым и объективным.
Что такое адаптивный ATR в этом индикаторе
Вместо классического ATR, который просто усредняет истинный диапазон, здесь используется собственный алгоритм:
✅ Он берет дневные бары за последние 100 дней.
✅ Для каждого из них рассчитывает диапазон High - Low.
✅ Если диапазон бара слишком сильно отличается от среднего (более чем в 1.8 раза больше или меньше), бар считается аномальным и игнорируется.
✅ Только нормальные бары попадают в расчёт.
✅ В итоге считается среднее из диапазонов этих нормальных баров — это и есть адаптивный ATR.
Подробный алгоритм функции getAdaptiveATR()
Функция принимает количество баров для расчёта (например, 5):
Считается 5 последних нормальных баров
pinescript
Копировать
Редактировать
adaptiveATR = getAdaptiveATR(5)
Пошагово:
Создаётся пустой массив ranges для хранения диапазонов.
Перебираются дневные бары с индексами от 1 до 100.
Для каждого бара:
🔹 Через request.security() подгружаются дневные High и Low с нужным смещением.
🔹 Считается диапазон High - Low.
🔹 Считается временное среднее диапазона по текущему массиву.
🔹 Проверяется, не является ли бар аномальным (слишком большой или маленький).
🔹 Если бар нормальный или это самый первый бар — его диапазон добавляется в массив.
Как только массив набирает заданное количество баров (count), берётся их среднее значение — это и есть адаптивный ATR.
Если не удалось набрать нужное количество баров — возвращается na.
發行說明
What the Indicator Shows:A compact table with four cells is displayed in the bottom-left corner of the chart:
| ATR | % | Level | Lvl+ATR |
Explanation of the Columns:
ATR — The averaged daily range (volatility) calculated with filtering of abnormal bars (extremely large or small daily candles are ignored).
% — The percentage of the daily ATR that the price has already covered today (the difference between the daily Open and Close relative to ATR).
Level — A custom user-defined level set through the indicator settings.
Lvl+ATR — The sum of the daily ATR and the user-defined level. This can be used, for example, as a target or stop-loss reference.
Color Highlighting of the "%" Cell:
The background color of the "%" ATR cell changes depending on the value:
✅ If the value is less than 10% — the cell is green (market is calm, small movement).
➖ If the value is between 10% and 50% — no highlighting (average movement, no signal).
🟡 If the value is between 50% and 70% — the cell is yellow (movement is increasing, be alert).
🔴 If the value is above 70% — the cell is red (the market is actively moving, high volatility).
Key Features:
✔ All ATR calculations and percentage progress are performed strictly based on daily data, regardless of the chart's current timeframe.
✔ The indicator is ideal for intraday traders who want to monitor daily volatility levels.
✔ The table always displays up-to-date information for quick decision-making.
✔ Filtering of abnormal bars makes ATR more stable and objective.
What is Adaptive ATR in this Indicator:
Instead of the classic ATR, which simply averages the true range, this indicator uses a custom algorithm:
✅ It analyzes daily bars over the past 100 days.
✅ Calculates the range High - Low for each bar.
✅ If the bar's range deviates too much from the average (more than 1.8 times higher or lower), the bar is considered abnormal and ignored.
✅ Only "normal" bars are included in the calculation.
✅ The average range of these normal bars is the adaptive ATR.
Detailed Algorithm of the getAdaptiveATR() Function:
The function takes the number of bars to include in the calculation (for example, 5):
The average of the last 5 normal bars is calculated.
pinescript
Копировать
Редактировать
adaptiveATR = getAdaptiveATR(5)
Step-by-Step Process:
An empty array ranges is created to store the ranges.
Daily bars with indices from 1 to 100 are iterated over.
For each bar:
🔹 The daily High and Low with the required offset are loaded via request.security().
🔹 The range High - Low is calculated.
🔹 The temporary average range of the current array is calculated.
🔹 The bar is checked for abnormality (too large or too small).
🔹 If the bar is normal or it's the first bar — its range is added to the array.
Once the array accumulates the required number of bars (count), their average is calculated — this is the adaptive ATR.
If it's not possible to accumulate the required number of bars — na is returned.
發行說明
Corrected ATR calculation: now it's always calculated based on the daily timeframe.Removed table headers.
Скорректировал расчет ATR, теперь всегда расчет с дневки, убрал заголовки таблицы.
發行說明
new發行說明
✅ The number of table columns changes dynamically.✅ Table headers are displayed optionally.
✅ The columns with levels can be hidden with a separate checkbox.
✅ Динамически меняется количество столбцов таблицы.
✅ Заголовки отображаются по желанию.
✅ Столбцы с уровнями можно убрать отдельной галочкой.
發行說明
Fixed an error with the last paranormal bar that was included in the calculation
Исправлена ошибка последнего паранормального бара который попадал в расчет
發行說明
Fixed an issue where if there is insufficient data, the previous day's value is displayed發行說明
Added the ability to select the table display location.開源腳本
秉持TradingView一貫精神,這個腳本的創作者將其設為開源,以便交易者檢視並驗證其功能。向作者致敬!您可以免費使用此腳本,但請注意,重新發佈代碼需遵守我們的社群規範。
免責聲明
這些資訊和出版物並非旨在提供,也不構成TradingView提供或認可的任何形式的財務、投資、交易或其他類型的建議或推薦。請閱讀使用條款以了解更多資訊。
開源腳本
秉持TradingView一貫精神,這個腳本的創作者將其設為開源,以便交易者檢視並驗證其功能。向作者致敬!您可以免費使用此腳本,但請注意,重新發佈代碼需遵守我們的社群規範。
免責聲明
這些資訊和出版物並非旨在提供,也不構成TradingView提供或認可的任何形式的財務、投資、交易或其他類型的建議或推薦。請閱讀使用條款以了解更多資訊。