OPEN-SOURCE SCRIPT
已更新 RAT Momentum Squeeze BETA
V1.0
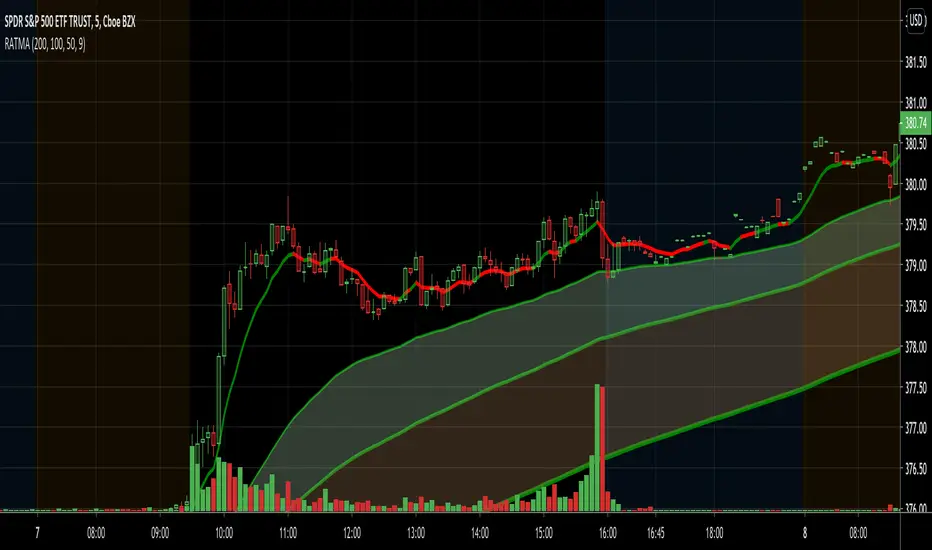
MAs are a great tool to measure the market's momentum. I created this indicator to graphically depict bullish and banishment movements with the moving averages.
Using the 50, 100, & 200 day MA in conjunction with the RSI we are able to find great swing setups. This is used best on the 30min & up to the daily chart.
發行說明
*Cleaned up code發行說明
V1.0 Release NotesAdded 9-day moving average with dynamic color based on 9-day RSI over/oversold levels
Added dynamic color changing to all moving averages based on the directional movement
發行說明
Added conditional formatting to the colors on the 9-day moving average. The greener the color, the more overbought. The darker the red, the more oversold. I will tweak the colors of the cloud and line itself in a future update.發行說明
Exciting new update :)-Added improved accuracy for the strength in the trend by calculating different RSI lengths
-Added bar overlays to help show the strength of the trend
-Improved colors on the 9 day MA overlay

發行說明
Switched MAs to EMAs. After doing extensive backtesting I think EMAs are much more accurate for the purpose of this indicator 發行說明
Changed SMAs to EMAs for improved accuracy 發行說明
changed RSI sensitivity 開源腳本
秉持TradingView一貫精神,這個腳本的創作者將其設為開源,以便交易者檢視並驗證其功能。向作者致敬!您可以免費使用此腳本,但請注意,重新發佈代碼需遵守我們的社群規範。
免責聲明
這些資訊和出版物並非旨在提供,也不構成TradingView提供或認可的任何形式的財務、投資、交易或其他類型的建議或推薦。請閱讀使用條款以了解更多資訊。
開源腳本
秉持TradingView一貫精神,這個腳本的創作者將其設為開源,以便交易者檢視並驗證其功能。向作者致敬!您可以免費使用此腳本,但請注意,重新發佈代碼需遵守我們的社群規範。
免責聲明
這些資訊和出版物並非旨在提供,也不構成TradingView提供或認可的任何形式的財務、投資、交易或其他類型的建議或推薦。請閱讀使用條款以了解更多資訊。