OPEN-SOURCE SCRIPT
已更新 Crunchster's Real Price
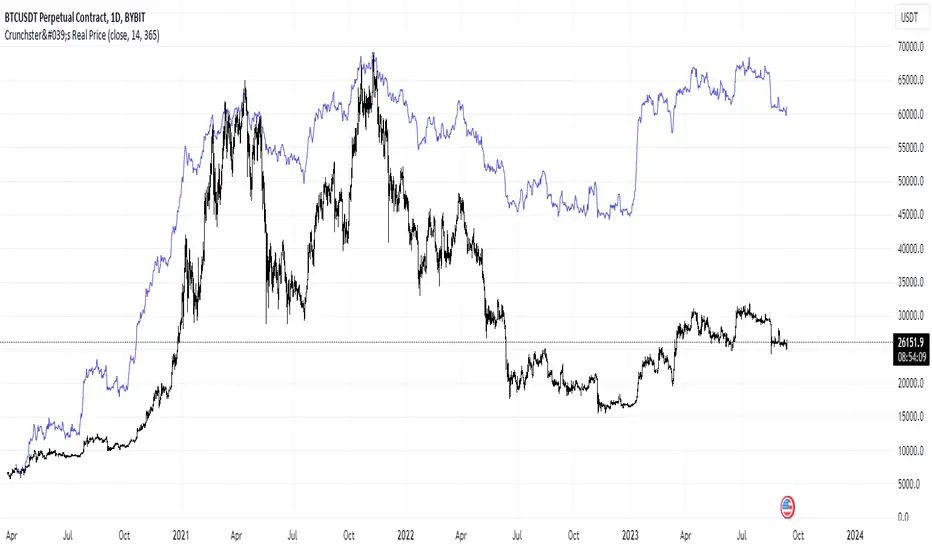
This is a simple transformation of any price series (best suited to daily timeframe) that filters out random price fluctuations and revealing the "real" price action. It allows comparison between different assets easily and is a useful confirmation of support and resistance levels, or can be used with other technical analysis.
In the default settings based on a daily chart, the daily returns are first calculated, then volatility normalised by dividing by the standard deviation of daily returns over the defined lookback period (14 periods by default).
These normalised returns are then added together over the entire price series period, to create a new "Real price" - the volatility adjusted price. This is the default presentation.
In addition, a second signal ("Normalised price series over rolling period") is available which, instead of summing the normalised returns over the entire price series, allows a user configurable, rolling lookback window over which the normalised returns are summed up. The default setting is 365 periods (ie 1 year on the daily timeframe for tickers with 24hr markets such as crypto. This can be set to 252 periods if analysing equities, which only trade 5 days per week, or any other user defined period of interest).
發行說明
Added configurable source發行說明
Updated to overlay main chart開源腳本
秉持TradingView一貫精神,這個腳本的創作者將其設為開源,以便交易者檢視並驗證其功能。向作者致敬!您可以免費使用此腳本,但請注意,重新發佈代碼需遵守我們的社群規範。
Join me on Mizar.com and trade my strategies
免責聲明
這些資訊和出版物並非旨在提供,也不構成TradingView提供或認可的任何形式的財務、投資、交易或其他類型的建議或推薦。請閱讀使用條款以了解更多資訊。
開源腳本
秉持TradingView一貫精神,這個腳本的創作者將其設為開源,以便交易者檢視並驗證其功能。向作者致敬!您可以免費使用此腳本,但請注意,重新發佈代碼需遵守我們的社群規範。
Join me on Mizar.com and trade my strategies
免責聲明
這些資訊和出版物並非旨在提供,也不構成TradingView提供或認可的任何形式的財務、投資、交易或其他類型的建議或推薦。請閱讀使用條款以了解更多資訊。