OPEN-SOURCE SCRIPT
Price Relative / Relative Strength Comparative [NeoButane]
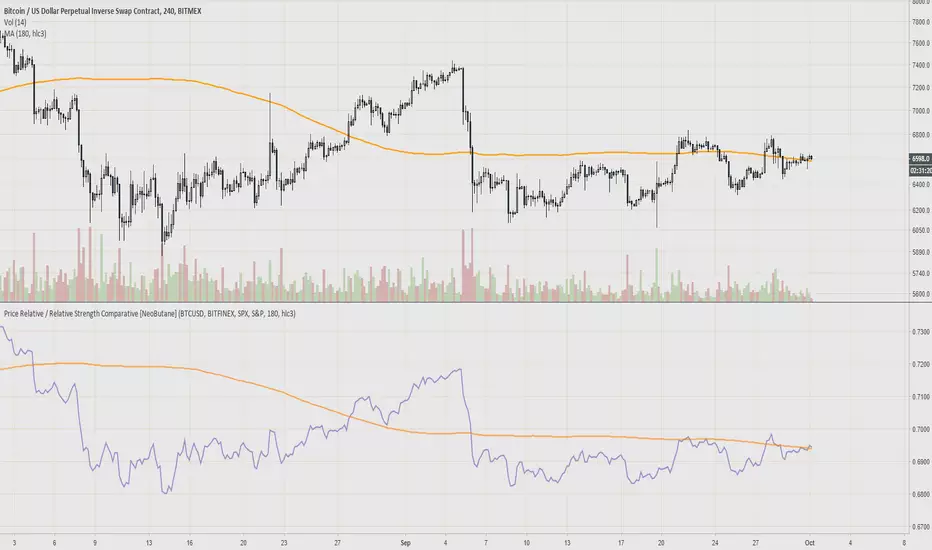
"The Price Relative indicator compares the performance of one security to another with a ratio chart."
Divergences and chart patterns can apply to this ratio.
This was created because I wanted to compare bitcoin to currency/stock indices. So far I've seen mostly confluence with cryptos. Comparing stocks against market indices better shows where the index begins to outperform the stock before price action can reveal dips in price. Using same length moving averages or divergences can help spot that.
There's a glitch where candle colors turn blue when editing. Turn the candles on and off to fix it.
Reference: stockcharts.com/school/doku.php?id=chart_school:technical_indicators:price_relative
Formula:
Price Relative = Base Security / Comparative Security
Ratio Symbol Close = Close of First Symbol / Close of Second Symbol
Ratio Symbol Open = Open of First Symbol / Close of Second Symbol
Ratio Symbol High = High of First Symbol / Close of Second Symbol
Ratio Symbol Low = Low of First Symbol / Close of Second Symbol
Note: Although StockCharts states
"Base Security / Comparative Security"
I've used
"Base Security / (Base Security + Comparative Security)
to create a ratio as the article has stated it should be.
Possible use: margin/CVD
開源腳本
秉持TradingView一貫精神,這個腳本的創作者將其設為開源,以便交易者檢視並驗證其功能。向作者致敬!您可以免費使用此腳本,但請注意,重新發佈代碼需遵守我們的社群規範。
My published indicators: tradingview.com/u/NeoButane/
Sorry if I haven't replied to your message yet, I'm a bit backlogged :)
Sorry if I haven't replied to your message yet, I'm a bit backlogged :)
免責聲明
這些資訊和出版物並非旨在提供,也不構成TradingView提供或認可的任何形式的財務、投資、交易或其他類型的建議或推薦。請閱讀使用條款以了解更多資訊。