OPEN-SOURCE SCRIPT
Line Strategy v6
Line Indicator for TradingView
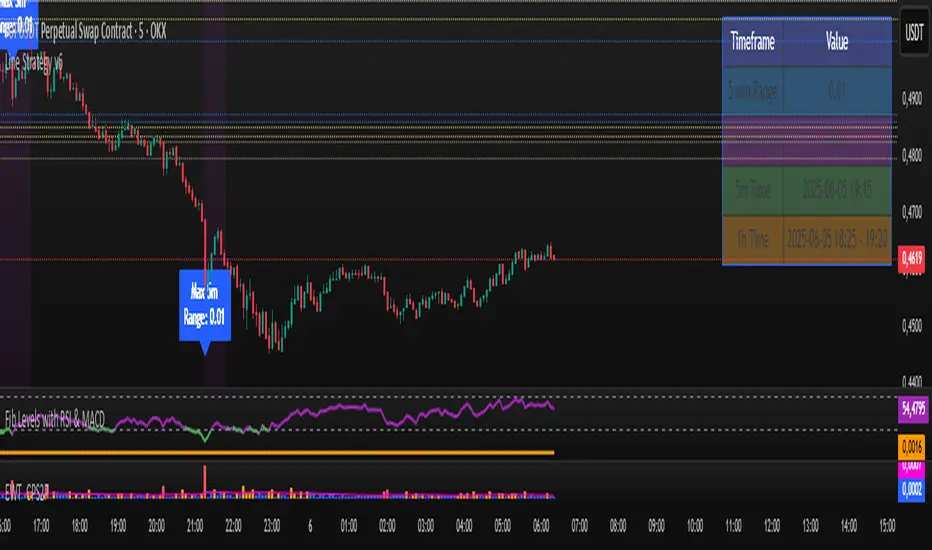
This Pine Script indicator identifies the largest candles on both 5-minute and 1-hour timeframes within the last 240 five-minute bars. It provides visual markers and detailed information to help traders spot significant price movements.
Key Features
Dual Timeframe Analysis:
Identifies largest candle on 5-minute timeframe
Identifies largest candle on 1-hour timeframe (aggregated from 12 five-minute candles)
Visual Markers:
Blue label marks the highest-range 5-minute candle
Purple background highlights the highest-range hourly candle period
Information Table:
Shows price ranges for both timeframes
Displays precise timestamps for identified candles
Color-coded for quick reference
Progress Indicator:
Shows how many bars have been collected (out of 240 required)
How It Works
Data Collection:
Stores high, low, timestamp, and bar index of the last 240 five-minute candles
Automatically updates with each new bar
5-Minute Analysis:
Scans all 5-minute candles to find the one with the largest price range (high - low)
Marks this candle with a blue label showing its range
Hourly Analysis:
Groups 12 five-minute candles to form each hourly candle
Finds the hourly candle with the largest price range
Highlights the entire hour period with a purple background
Information Display:
Creates a table in the top-right corner showing:
Range values for both timeframes
Timestamps of identified candles
Time period of the largest hourly candle
Usage Instructions
Apply the indicator to any 5-minute chart
Wait for the indicator to collect 240 bars (about 20 trading hours)
Results will appear automatically:
Blue label on the largest 5-minute candle
Purple background on the largest hourly candle period
Information table with detailed metrics
Customization Options
You can easily adjust these aspects by modifying the code:
Colors of markers and table cells
Transparency levels of background highlights
Precision of range values displayed
Position of the information table
The indicator is optimized for performance and works in both historical and real-time modes.
開源腳本
秉持TradingView一貫精神,這個腳本的創作者將其設為開源,以便交易者檢視並驗證其功能。向作者致敬!您可以免費使用此腳本,但請注意,重新發佈代碼需遵守我們的社群規範。
免責聲明
這些資訊和出版物並非旨在提供,也不構成TradingView提供或認可的任何形式的財務、投資、交易或其他類型的建議或推薦。請閱讀使用條款以了解更多資訊。
開源腳本
秉持TradingView一貫精神,這個腳本的創作者將其設為開源,以便交易者檢視並驗證其功能。向作者致敬!您可以免費使用此腳本,但請注意,重新發佈代碼需遵守我們的社群規範。
免責聲明
這些資訊和出版物並非旨在提供,也不構成TradingView提供或認可的任何形式的財務、投資、交易或其他類型的建議或推薦。請閱讀使用條款以了解更多資訊。