OPEN-SOURCE SCRIPT
HL range by durga
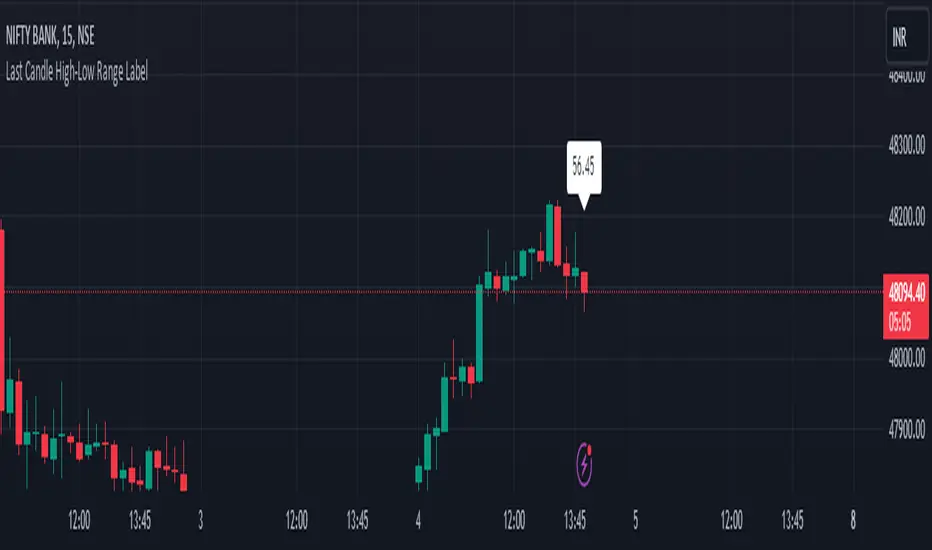
The script we've been working on is an indicator designed to display the high-low range of the last candlestick on a TradingView chart. It does so by plotting two lines: one for the high and another for the low of the last completed candlestick.
Additionally, the script includes a label that shows the numerical value of the high-low range. This label is positioned between the plotted lines, showing the difference between the high and low prices of the last candlestick.
The script operates in real-time, updating dynamically as new candlesticks form. Furthermore, it automatically removes the label after the close of the candlestick, maintaining a clean and clutter-free chart.
This indicator can help traders quickly visualize and assess the range of the last completed candlestick, aiding in their analysis of price action.
開源腳本
秉持TradingView一貫精神,這個腳本的創作者將其設為開源,以便交易者檢視並驗證其功能。向作者致敬!您可以免費使用此腳本,但請注意,重新發佈代碼需遵守我們的社群規範。
免責聲明
這些資訊和出版物並非旨在提供,也不構成TradingView提供或認可的任何形式的財務、投資、交易或其他類型的建議或推薦。請閱讀使用條款以了解更多資訊。
開源腳本
秉持TradingView一貫精神,這個腳本的創作者將其設為開源,以便交易者檢視並驗證其功能。向作者致敬!您可以免費使用此腳本,但請注意,重新發佈代碼需遵守我們的社群規範。
免責聲明
這些資訊和出版物並非旨在提供,也不構成TradingView提供或認可的任何形式的財務、投資、交易或其他類型的建議或推薦。請閱讀使用條款以了解更多資訊。