OPEN-SOURCE SCRIPT
Big Volumes Highlighter
Big Volumes Highlighter
Overview:
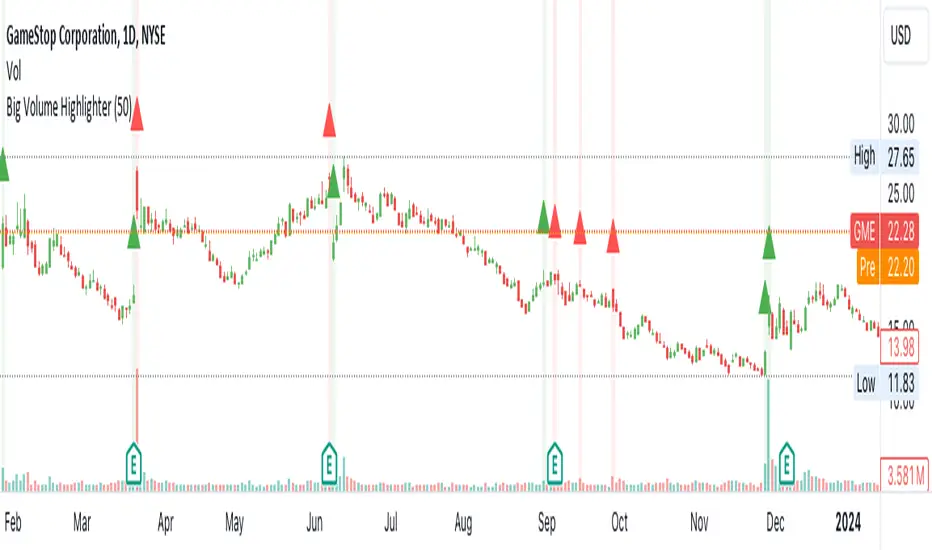
The "Big Volume Highlighter" is a powerful tool designed to help traders quickly identify candles with the highest trading volume over a specified period. This indicator not only highlights the most significant volume candles but also color-codes them based on the candle's direction—green for bullish (close > open) and red for bearish (close < open). Whether you're analyzing volume spikes or looking for key moments in price action, this indicator provides clear visual cues to enhance your trading decisions.
Features:
Customizable Lookback Period: Define the number of candles to consider when determining the highest volume.
Automatic Color Coding: Candles with the highest volume are highlighted in green if bullish and red if bearish.
Visual Clarity: The indicator marks the significant volume candles with a triangle above the bar and changes the background color to match, making it easy to spot important volume events at a glance.
Use Cases:
Volume Spike Detection:
Quickly identify when a large volume enters the market, which may indicate significant buying or selling pressure.
Trend Confirmation: Use volume spikes to confirm trends or potential reversals by observing the direction of the high-volume candles.
Market Sentiment Analysis: Understand market sentiment by analyzing the direction of the candles with the biggest volumes.
How to Use:
Add the "Big Volume Highlighter" to your chart.
Adjust the lookback period to suit your analysis.
Observe the highlighted candles for insights into market dynamics.
This script is ideal for traders who want to incorporate volume analysis into their technical strategy, providing a simple yet effective way to monitor significant volume changes in the market.
Overview:
The "Big Volume Highlighter" is a powerful tool designed to help traders quickly identify candles with the highest trading volume over a specified period. This indicator not only highlights the most significant volume candles but also color-codes them based on the candle's direction—green for bullish (close > open) and red for bearish (close < open). Whether you're analyzing volume spikes or looking for key moments in price action, this indicator provides clear visual cues to enhance your trading decisions.
Features:
Customizable Lookback Period: Define the number of candles to consider when determining the highest volume.
Automatic Color Coding: Candles with the highest volume are highlighted in green if bullish and red if bearish.
Visual Clarity: The indicator marks the significant volume candles with a triangle above the bar and changes the background color to match, making it easy to spot important volume events at a glance.
Use Cases:
Volume Spike Detection:
Quickly identify when a large volume enters the market, which may indicate significant buying or selling pressure.
Trend Confirmation: Use volume spikes to confirm trends or potential reversals by observing the direction of the high-volume candles.
Market Sentiment Analysis: Understand market sentiment by analyzing the direction of the candles with the biggest volumes.
How to Use:
Add the "Big Volume Highlighter" to your chart.
Adjust the lookback period to suit your analysis.
Observe the highlighted candles for insights into market dynamics.
This script is ideal for traders who want to incorporate volume analysis into their technical strategy, providing a simple yet effective way to monitor significant volume changes in the market.
開源腳本
秉持TradingView一貫精神,這個腳本的創作者將其設為開源,以便交易者檢視並驗證其功能。向作者致敬!您可以免費使用此腳本,但請注意,重新發佈代碼需遵守我們的社群規範。
免責聲明
這些資訊和出版物並非旨在提供,也不構成TradingView提供或認可的任何形式的財務、投資、交易或其他類型的建議或推薦。請閱讀使用條款以了解更多資訊。
開源腳本
秉持TradingView一貫精神,這個腳本的創作者將其設為開源,以便交易者檢視並驗證其功能。向作者致敬!您可以免費使用此腳本,但請注意,重新發佈代碼需遵守我們的社群規範。
免責聲明
這些資訊和出版物並非旨在提供,也不構成TradingView提供或認可的任何形式的財務、投資、交易或其他類型的建議或推薦。請閱讀使用條款以了解更多資訊。