OPEN-SOURCE SCRIPT
已更新 Liquidity Weighted Moving Averages [AlgoAlpha]
Description:
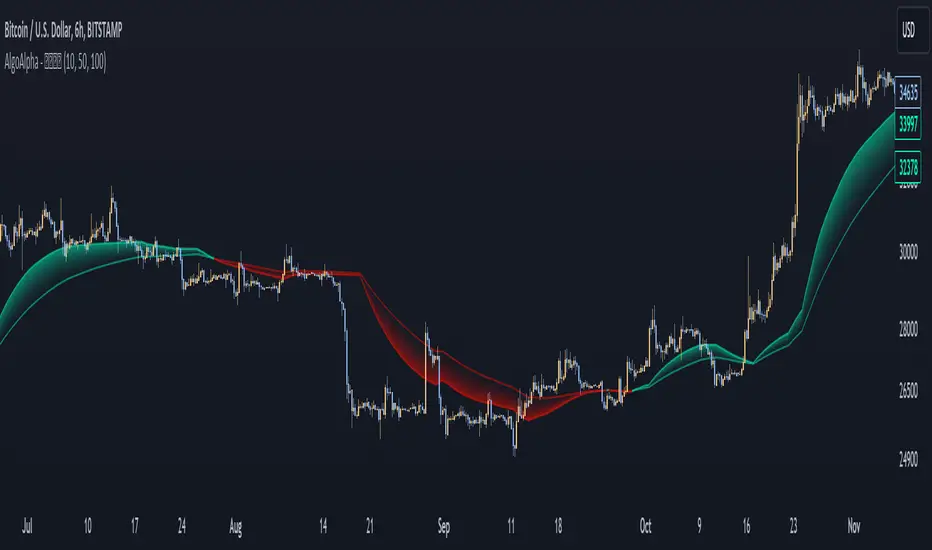
The Liquidity Weighted Moving Averages by AlgoAlpha is a unique approach to identifying underlying trends in the market by looking at candle bars with the highest level of liquidity. This script offers a modified version of the classical MA crossover indicator that aims to be less noisy by using liquidity to determine the true fair value of price and where it should place more emphasis on when calculating the average.
Rationale:
It is common knowledge that liquidity makes it harder for market participants to move the price of assets, using this logic, we can determine the coincident liquidity of each bar by looking at the volume divided by the distance between the opening and closing price of that bar. If there is a higher volume but the opening and closing prices are near each other, this means that there was a high level of liquidity in that bar. We then use standard deviations to filter out high spikes of liquidity and record the closing prices on those bars. An average is then applied to these recorded prices only instead of taking the average of every single bar to avoid including outliers in the data processing.
Key features:
Customizable:
Fast Length - the period of the fast-moving average
Slow Length - the period of the slow-moving average
Outlier Threshold Length - the period of the outlier processing algorithm to detect spikes in liquidity
Significant Noise reduction from outliers:
發行說明
Added Alerts發行說明
Added Timeframe Switching開源腳本
秉持TradingView一貫精神,這個腳本的創作者將其設為開源,以便交易者檢視並驗證其功能。向作者致敬!您可以免費使用此腳本,但請注意,重新發佈代碼需遵守我們的社群規範。
🚨Get premium: algoalpha.io
🛜Get FREE signals: discord.gg/xCmqTVRexz
❓Do you have feedback or indicator ideas? Join our server to tell us about it!
🛜Get FREE signals: discord.gg/xCmqTVRexz
❓Do you have feedback or indicator ideas? Join our server to tell us about it!
免責聲明
這些資訊和出版物並非旨在提供,也不構成TradingView提供或認可的任何形式的財務、投資、交易或其他類型的建議或推薦。請閱讀使用條款以了解更多資訊。
開源腳本
秉持TradingView一貫精神,這個腳本的創作者將其設為開源,以便交易者檢視並驗證其功能。向作者致敬!您可以免費使用此腳本,但請注意,重新發佈代碼需遵守我們的社群規範。
🚨Get premium: algoalpha.io
🛜Get FREE signals: discord.gg/xCmqTVRexz
❓Do you have feedback or indicator ideas? Join our server to tell us about it!
🛜Get FREE signals: discord.gg/xCmqTVRexz
❓Do you have feedback or indicator ideas? Join our server to tell us about it!
免責聲明
這些資訊和出版物並非旨在提供,也不構成TradingView提供或認可的任何形式的財務、投資、交易或其他類型的建議或推薦。請閱讀使用條款以了解更多資訊。