OPEN-SOURCE SCRIPT
已更新 Multi‑Timeframe RSIOMA Dashboard
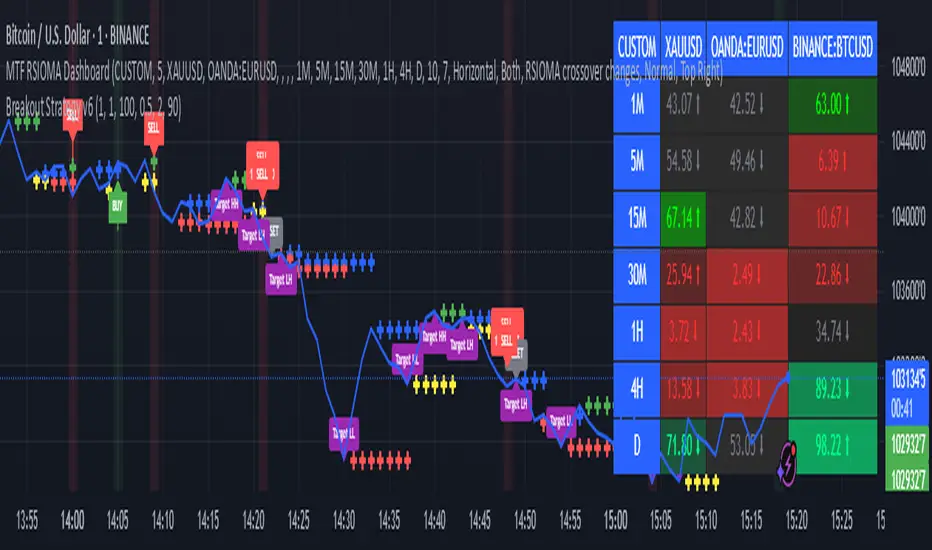
The Multi-Timeframe RSIOMA Dashboard is a TradingView tool that displays RSIOMA (Relative Strength Index Over Moving Average) values for up to 10 symbols across multiple timeframes in a color-coded table. It helps traders spot bullish (>50, green) or bearish (<50, red) momentum, with optional MA smoothing for clearer trends. Customize symbols, timeframes, and settings to track market strength at a glanc
發行說明
UPDATE 發行說明
UPDATE發行說明
UPDATE發行說明
update 發行說明
update發行說明
UPDATE發行說明
update發行說明
UPDATE發行說明
update 發行說明
UPDATE 開源腳本
秉持TradingView一貫精神,這個腳本的創作者將其設為開源,以便交易者檢視並驗證其功能。向作者致敬!您可以免費使用此腳本,但請注意,重新發佈代碼需遵守我們的社群規範。
免責聲明
這些資訊和出版物並非旨在提供,也不構成TradingView提供或認可的任何形式的財務、投資、交易或其他類型的建議或推薦。請閱讀使用條款以了解更多資訊。
開源腳本
秉持TradingView一貫精神,這個腳本的創作者將其設為開源,以便交易者檢視並驗證其功能。向作者致敬!您可以免費使用此腳本,但請注意,重新發佈代碼需遵守我們的社群規範。
免責聲明
這些資訊和出版物並非旨在提供,也不構成TradingView提供或認可的任何形式的財務、投資、交易或其他類型的建議或推薦。請閱讀使用條款以了解更多資訊。