OPEN-SOURCE SCRIPT
Renko Dots [racer8]
Description:
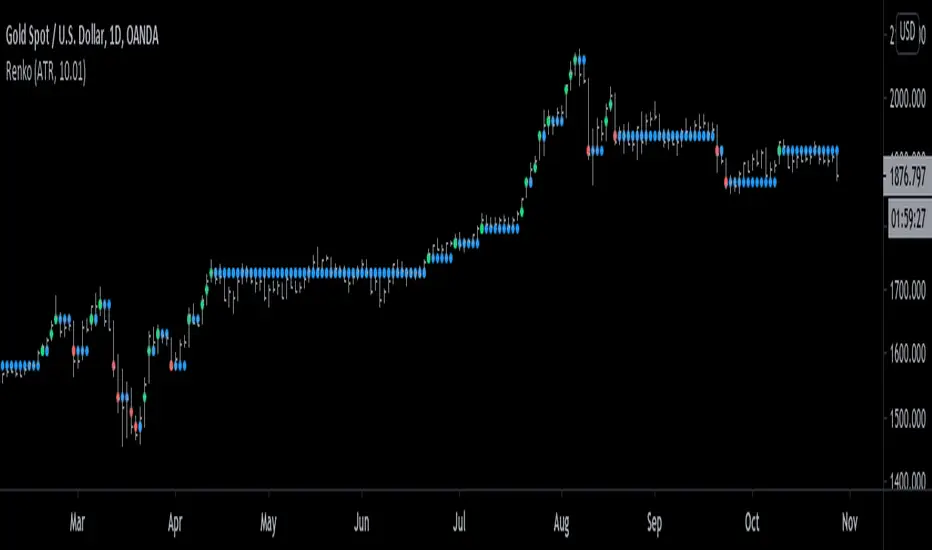
The idea behind this indicator is to have the Renko chart alongside with your main chart. What this indicator does is that it plots the values from the Renko Chart directly onto your main chart. So, you don't have to switch between Renko and OHLC charts anymore!
Parameters:
Renko Dots has to 2 parameters: Method & Length.
Method can be either Traditional or ATR. These are 2 different styles of Renko. Personally, I prefer ATR.
Length controls traditional Renko bar's fixed price range or controls the ATR period.
Signal Interpretation:
These Renko values are plotted as "Renko Dots" on your chart. The dots can be either green, red, or blue depending on market movements.
Green - new Renko bar (bullish)
Red - new Renko bar (bearish)
Blue - no new Renko bar (consolidation)
What is a Renko chart?
A Renko chart is a special chart that modifies a regular price chart's information about the close price and transforms it into Renko values that are plotted as Renko boxes on a chart. These boxes typically have a fixed range, say 10 pips for example. So if price moves at least 10 pips, a box is formed. Alternatively, the box's range can be set to the ATR....so in this case, each box represents a move of 1 ATR.
For more information on Renko charts, visit Investopedia.com, here's the link: investopedia.com/terms/r/renkochart.asp
Renko Dots' advantages over standard Renko chart:
- Can compare & apply it to other price charts (ohlc, candlesticks, line charts)
- Can apply it to other modified price charts (Heikin-Ashi, Renko, Line-Break)
- Can use it to trade alongside with the main chart
- Works across all instruments/markets and all time frames
- Plots consolidation (blue dots) ... (standard Renko doesn't consider time)
Enjoy :)
開源腳本
秉持TradingView一貫精神,這個腳本的創作者將其設為開源,以便交易者檢視並驗證其功能。向作者致敬!您可以免費使用此腳本,但請注意,重新發佈代碼需遵守我們的社群規範。
免責聲明
這些資訊和出版物並非旨在提供,也不構成TradingView提供或認可的任何形式的財務、投資、交易或其他類型的建議或推薦。請閱讀使用條款以了解更多資訊。
免責聲明
這些資訊和出版物並非旨在提供,也不構成TradingView提供或認可的任何形式的財務、投資、交易或其他類型的建議或推薦。請閱讀使用條款以了解更多資訊。