OPEN-SOURCE SCRIPT
MOKI V1
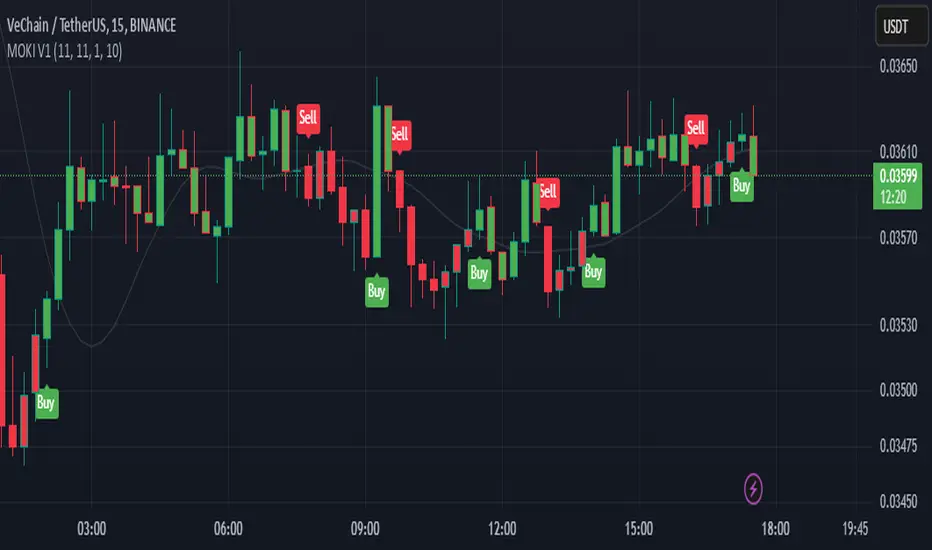
The "MOKI V1" script is a trading strategy on the TradingView platform that uses a combination of two key indicators to identify buy and sell signals:
EMA200 (Exponential Moving Average 200): Used to determine the overall market trend. This line helps ensure that trades are made in the direction of the primary market trend.
RSI (Relative Strength Index): Used to measure the strength or weakness of a trend. In this strategy, a reading above 50 for the RSI indicates stronger buy signals.
Engulfing Pattern: This candlestick pattern occurs when a green (bullish) candle completely engulfs the previous red (bearish) candle. It is used as a buy signal when combined with the other indicators.
開源腳本
秉持TradingView一貫精神,這個腳本的創作者將其設為開源,以便交易者檢視並驗證其功能。向作者致敬!您可以免費使用此腳本,但請注意,重新發佈代碼需遵守我們的社群規範。
免責聲明
這些資訊和出版物並非旨在提供,也不構成TradingView提供或認可的任何形式的財務、投資、交易或其他類型的建議或推薦。請閱讀使用條款以了解更多資訊。
開源腳本
秉持TradingView一貫精神,這個腳本的創作者將其設為開源,以便交易者檢視並驗證其功能。向作者致敬!您可以免費使用此腳本,但請注意,重新發佈代碼需遵守我們的社群規範。
免責聲明
這些資訊和出版物並非旨在提供,也不構成TradingView提供或認可的任何形式的財務、投資、交易或其他類型的建議或推薦。請閱讀使用條款以了解更多資訊。