OPEN-SOURCE SCRIPT
已更新 Fractal Breakout V2

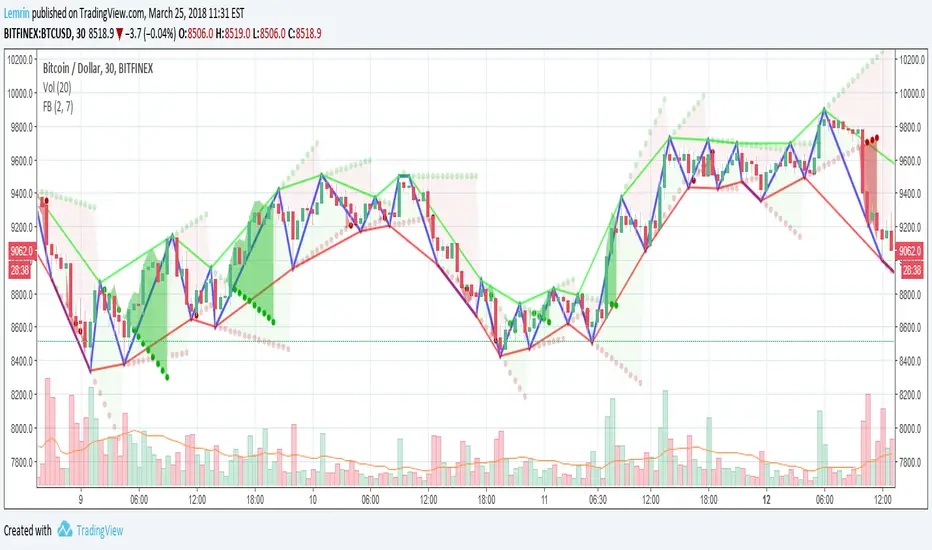
Version 2 of my fractal pattern aid (Version 1).
I added a bouncing line between the high and low trend lines, connecting consecutive extreme points. I also chased down a pesky bug in the slope calculation...and for now I have disabled the ability to change resolution basis for extreme detection (e.g. 30m on a 1hr chart).
For fun, I added some shading to make it more apparent at a glance what is happening, but if you find it gimmicky, there's an option to turn that off.
I am inexperienced with pattern recognition, so please send feedback if you have any ideas that would make this more useful.
Thanks!
Lemrin
發行說明
Extensions to upper and lower boundary lines now continue through new extreme points, as long as that point is within a configurable ratio of the extended line. This helps identify when important resistance/support or pattern formation lines have been broken. To add visibility to such conditions, I have re-enabled shading by default, based on price breaking outside the extended boundary lines.發行說明
Found a bug, where a perfect storm could cause extensions to become limitlessly negative.發行說明
I kinda forgot to make the setting to turn off the new dotted extensions actually do anything. Sorry about that, fixed!開源腳本
秉持TradingView一貫精神,這個腳本的創作者將其設為開源,以便交易者檢視並驗證其功能。向作者致敬!您可以免費使用此腳本,但請注意,重新發佈代碼需遵守我們的社群規範。
免責聲明
這些資訊和出版物並非旨在提供,也不構成TradingView提供或認可的任何形式的財務、投資、交易或其他類型的建議或推薦。請閱讀使用條款以了解更多資訊。
開源腳本
秉持TradingView一貫精神,這個腳本的創作者將其設為開源,以便交易者檢視並驗證其功能。向作者致敬!您可以免費使用此腳本,但請注意,重新發佈代碼需遵守我們的社群規範。
免責聲明
這些資訊和出版物並非旨在提供,也不構成TradingView提供或認可的任何形式的財務、投資、交易或其他類型的建議或推薦。請閱讀使用條款以了解更多資訊。