OPEN-SOURCE SCRIPT
Coefficient of Variation [DW]
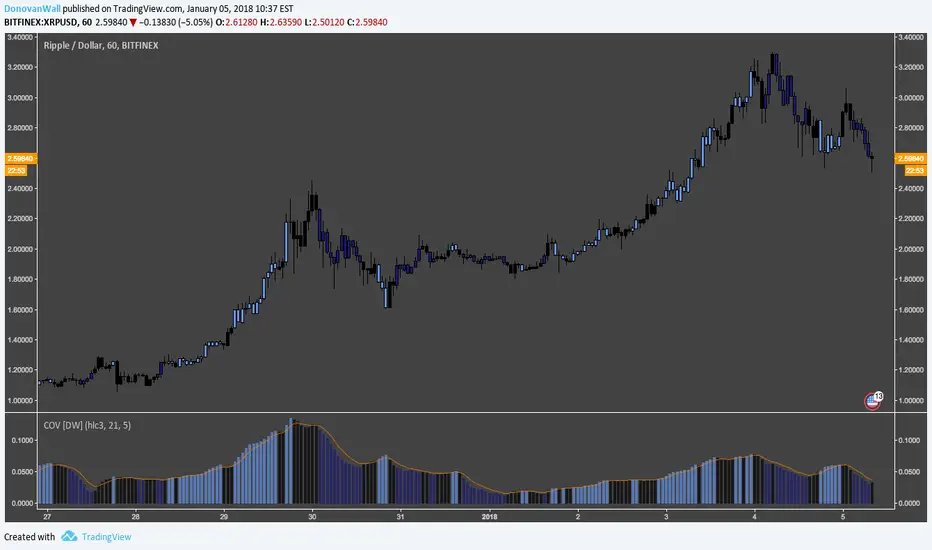
This is a simple gauge of volatility using the Coefficient of Variation.
COV is calculated by dividing standard deviation of price by the expected (average) price.
Custom color scheme indicates increases and decreases in volatility, which is indicated when the COV forms new half period highs and lows.
COV is calculated by dividing standard deviation of price by the expected (average) price.
Custom color scheme indicates increases and decreases in volatility, which is indicated when the COV forms new half period highs and lows.
開源腳本
秉持TradingView一貫精神,這個腳本的創作者將其設為開源,以便交易者檢視並驗證其功能。向作者致敬!您可以免費使用此腳本,但請注意,重新發佈代碼需遵守我們的社群規範。
For my full list of premium tools, check the blog:
wallanalytics.com/
Reach out on Telegram:
t.me/DonovanWall
wallanalytics.com/
Reach out on Telegram:
t.me/DonovanWall
免責聲明
這些資訊和出版物並非旨在提供,也不構成TradingView提供或認可的任何形式的財務、投資、交易或其他類型的建議或推薦。請閱讀使用條款以了解更多資訊。