PROTECTED SOURCE SCRIPT
已更新 IBD Market School [Professional]
IBD Market School [Professional]
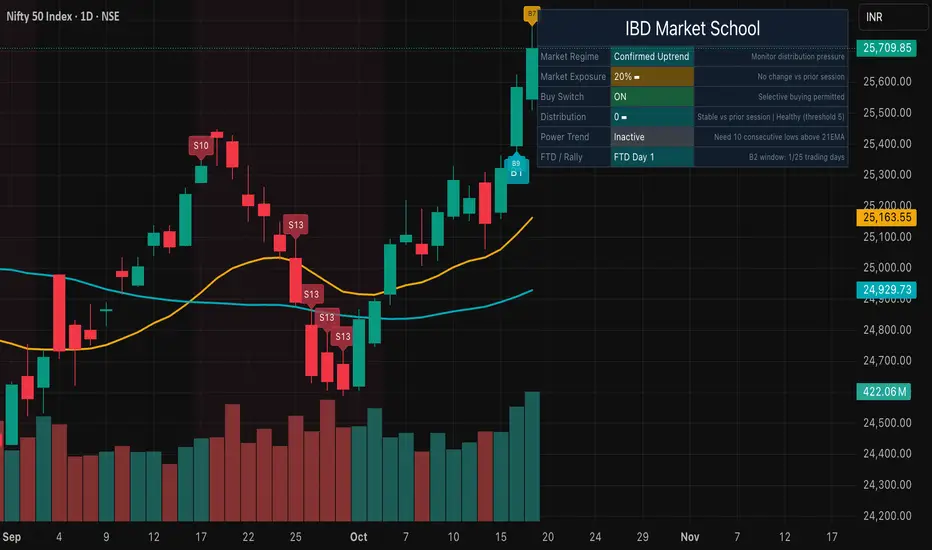
- Institutional-grade implementation of William O’Neil’s Market School timing system tuned for global and Indian benchmarks. Tracks corrections, rally attempts, follow-through days, power trends,
distribution/stalling clusters, dynamic exposure, buy switch state, and a fully themed dashboard—everything you need to keep portfolio risk aligned with Big Picture guidance.
Buy Rules
- B1 Follow-Through Day: day 4–10 of rally, gain ≥ configured %, volume > prior day.
- B2 Reinforcing FTD: second qualifying surge within 25 sessions of B1.
- B3 First Low ≥ 21 EMA after FTD.
- B4 Power Trend Start: 10 lows above 21 EMA, 21 EMA > 50 DMA (5+ days), rising 21 EMA, index within top 25% of 52-week range.
- B5 Living Above 21 EMA: every 5 additional days that the low holds the 21 EMA.
- B6 First close back above 50 DMA after confirmation.
- B7 New 52-week high in confirmed uptrend.
- B8 2× volume accumulation day with ≥1% gain.
- B9 Gap-up on above-average volume with positive close.
- B10 Accumulation day: ≥0.5% gain, 1.5× volume, close in top 20% of range.
- Additional context: ED (Expired Distribution) and 6% Rise markers track distribution clearing events.
Sell Rules
- S1 Heavy Distribution: distribution+stalling count ≥ threshold (default 5).
- S2 FTD Failure: index undercuts the Day 1 rally low post-FTD.
- S3 First break below 50 DMA after FTD.
- S4 Power trend loss: prior bar was in power trend and new close < 21 EMA.
- S5 Circuit breaker: single-day decline ≥ configured %.
- S6 Two-day cumulative decline ≥5%.
- S7 Three or more stalling days.
- S8 Volume Dry-Up: five consecutive below-average sessions with <0.5% range while confirmed.
- S9 Climax top reversal (≥3% surge with volume, then ≥1.5% drop next day).
- S10 Rally attempt exceeds FTD window (day > ftdMaxDay) without confirmation.
- S11 Distribution on an up day: small gain (<0.3%) on heavy volume closing in bottom 40% of range.
- S12 Undercut of rally Day 1 low while uptrend is confirmed.
- S13 Five straight down days.
- S14 First break below 200 DMA after confirmation.
Perfect for traders who want the full Market School cadence—rally confirmation, power-trend monitoring, distribution risk, and exposure guidance—all in one polished, fund-ready package.
發行說明
IBD Market School [Professional]- Institutional-grade implementation of William O’Neil’s Market School timing system tuned for global and Indian benchmarks. Tracks corrections, rally attempts, follow-through days, power trends,
distribution/stalling clusters, dynamic exposure, buy switch state, and a fully themed dashboard—everything you need to keep portfolio risk aligned with Big Picture guidance.
Buy Rules
- B1 Follow-Through Day: day 4–10 of rally, gain ≥ configured %, volume > prior day.
- B2 Reinforcing FTD: second qualifying surge within 25 sessions of B1.
- B3 First Low ≥ 21 EMA after FTD.
- B4 Power Trend Start: 10 lows above 21 EMA, 21 EMA > 50 DMA (5+ days), rising 21 EMA, index within top 25% of 52-week range.
- B5 Living Above 21 EMA: every 5 additional days that the low holds the 21 EMA.
- B6 First close back above 50 DMA after confirmation.
- B7 New 52-week high in confirmed uptrend.
- B8 2× volume accumulation day with ≥1% gain.
- B9 Gap-up on above-average volume with positive close.
- B10 Accumulation day: ≥0.5% gain, 1.5× volume, close in top 20% of range.
- Additional context: ED (Expired Distribution) and 6% Rise markers track distribution clearing events.
Sell Rules
- S1 Heavy Distribution: distribution+stalling count ≥ threshold (default 5).
- S2 FTD Failure: index undercuts the Day 1 rally low post-FTD.
- S3 First break below 50 DMA after FTD.
- S4 Power trend loss: prior bar was in power trend and new close < 21 EMA.
- S5 Circuit breaker: single-day decline ≥ configured %.
- S6 Two-day cumulative decline ≥5%.
- S7 Three or more stalling days.
- S8 Volume Dry-Up: five consecutive below-average sessions with <0.5% range while confirmed.
- S9 Climax top reversal (≥3% surge with volume, then ≥1.5% drop next day).
- S10 Rally attempt exceeds FTD window (day > ftdMaxDay) without confirmation.
- S11 Distribution on an up day: small gain (<0.3%) on heavy volume closing in bottom 40% of range.
- S12 Undercut of rally Day 1 low while uptrend is confirmed.
- S13 Five straight down days.
- S14 First break below 200 DMA after confirmation.
Perfect for traders who want the full Market School cadence—rally confirmation, power-trend monitoring, distribution risk, and exposure guidance—all in one polished, fund-ready package.
受保護腳本
此腳本以閉源形式發佈。 不過,您可以自由使用,沒有任何限制 — 點擊此處了解更多。
免責聲明
這些資訊和出版物並非旨在提供,也不構成TradingView提供或認可的任何形式的財務、投資、交易或其他類型的建議或推薦。請閱讀使用條款以了解更多資訊。
免責聲明
這些資訊和出版物並非旨在提供,也不構成TradingView提供或認可的任何形式的財務、投資、交易或其他類型的建議或推薦。請閱讀使用條款以了解更多資訊。