OPEN-SOURCE SCRIPT
Buffett Indicator [Bitcoin Machine]
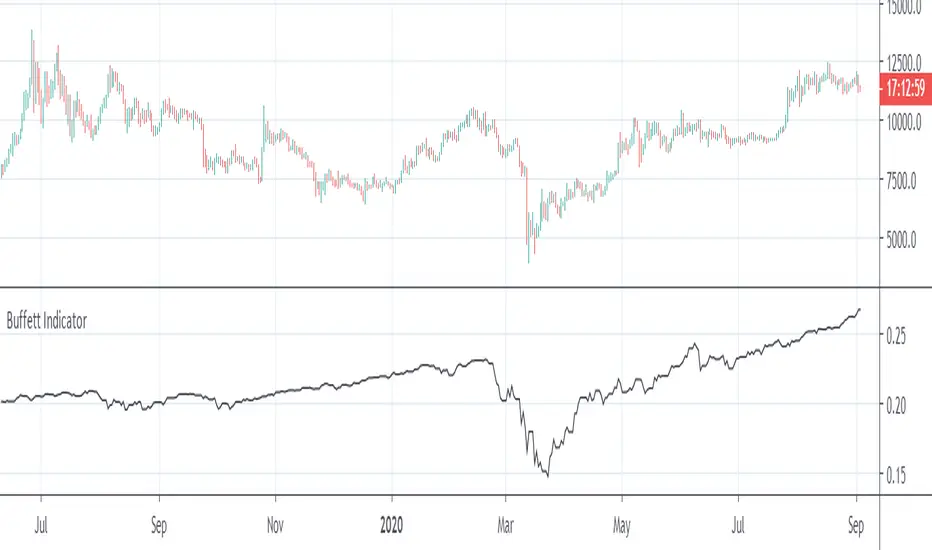
This is the Warren Buffett Indicator, the total market cap relative to the US gross domestic product (GDP). It is also called "Market Cap to GDP Indicator". For the market cap typically the Wilshire 5000 total market cap is used, which is representing the value of all stocks traded in the United States. Tradingview just provides the Wilshire W4500. We can calculate the W5000 by adding the S&P500 to the W4500.
Market Cap to GDP is a long-term valuation indicator and as pointed by Warren Buffett, the indicator is “probably the best single measure of where valuations stand at any given moment.” It used as a broad way of assessing whether the country’s stock market is overvalued or undervalued, compared to a historical average.
Remark: The Wilshire W4500 and the S&P500 are indices and denoted in "index points" (not USD). The Original Buffett Indicator is using market cap in US-Dollar. So the right scale of the indicator is different to the original one.
開源腳本
秉持TradingView一貫精神,這個腳本的創作者將其設為開源,以便交易者檢視並驗證其功能。向作者致敬!您可以免費使用此腳本,但請注意,重新發佈代碼需遵守我們的社群規範。
免責聲明
這些資訊和出版物並非旨在提供,也不構成TradingView提供或認可的任何形式的財務、投資、交易或其他類型的建議或推薦。請閱讀使用條款以了解更多資訊。
開源腳本
秉持TradingView一貫精神,這個腳本的創作者將其設為開源,以便交易者檢視並驗證其功能。向作者致敬!您可以免費使用此腳本,但請注意,重新發佈代碼需遵守我們的社群規範。
免責聲明
這些資訊和出版物並非旨在提供,也不構成TradingView提供或認可的任何形式的財務、投資、交易或其他類型的建議或推薦。請閱讀使用條款以了解更多資訊。