OPEN-SOURCE SCRIPT
Gaussian Average Rate Oscillator
- Within the ALMA calculation, the Gaussian function is applied to each price data point within the specified window. The idea is to give more weight to data points that are closer to the center and reduce the weight for points that are farther away.
The strategy calculates and compares two different Rate of Change (ROC) indicators: one based on the Arnaud Legoux Moving Average (ALMA) and the other based on a smoothed Exponential Moving Average (EMA). The primary goal of this strategy is to identify potential buy and sell signals based on the relationship between these ROC indicators.
Here's how the strategy logic works
Calculating the ROC Indicators:
The script first calculates the ROC (Rate of Change) of the smoothed ALMA and the smoothed EMA. The smoothed ALMA is calculated using a specified window size and is then smoothed further with a specified smoothing period. The smoothed EMA is calculated using a specified EMA length and is also smoothed with the same smoothing period.
Comparing ROCs:
The script compares the calculated ROC values of the smoothed ALMA and smoothed EMA.
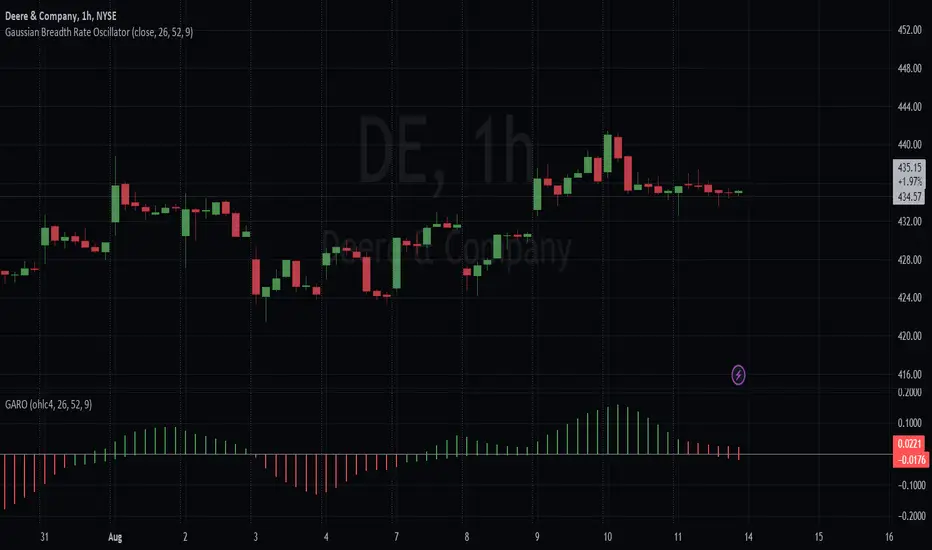
The color of the histogram bars representing the ROC of the smoothed ALMA depends on its relationship with the ROC of the smoothed EMA. Green indicates that the ROC of ALMA is higher, red indicates that it's lower, and black indicates equality.
Similarly, the color of the histogram bars representing the ROC of the smoothed EMA is determined based on its relationship with the ROC of the smoothed ALMA, they are simply inversed so that they match.
- With the default color scheme, green bars indicate the Gaussian average is outperforming the EMA within the breadth and red bars mean it's underperforming. This is regardless of the rate of average price changes.
Generating Trade Signals:
Based on the comparison of the ROC values, the strategy identifies potential crossover points and trends. Buy signals could occur when the ROC of the smoothed ALMA crosses above the ROC of the smoothed EMA. Sell signals could occur when the ROC of the smoothed ALMA crosses below the ROC of the smoothed EMA.
Additional Information:
The script also plots a zero rate line at the zero level to provide a reference point for interpreting the ROC values.
In summary, the strategy attempts to capture potential buy and sell signals by analyzing the relationships between the ROC values of the smoothed ALMA and the smoothed EMA. These signals can provide insights into potential trends and momentum shifts in the price data.
開源腳本
秉持TradingView一貫精神,這個腳本的創作者將其設為開源,以便交易者檢視並驗證其功能。向作者致敬!您可以免費使用此腳本,但請注意,重新發佈代碼需遵守我們的社群規範。
KP
免責聲明
這些資訊和出版物並非旨在提供,也不構成TradingView提供或認可的任何形式的財務、投資、交易或其他類型的建議或推薦。請閱讀使用條款以了解更多資訊。
免責聲明
這些資訊和出版物並非旨在提供,也不構成TradingView提供或認可的任何形式的財務、投資、交易或其他類型的建議或推薦。請閱讀使用條款以了解更多資訊。