OPEN-SOURCE SCRIPT
A_HMS_RSI_COMPOSIT
My majic Macd Indicator with Ema base macd is My great Indicator that combine four ema base macd lines with its signal lines that show price gravity by best way , and one spatial chart that is the best part of this magic indicator that help you to trading without any problem
for better use note that:
green fill line is ema 66 and ema 199 macd and signal its name is macd very slow signal line
blue fill line is ema 19 and ema 66 macd and signal its name is macd normal signal line
red fill line is ema 9 and ema 19 macd and signal its name is macd very fast signal line
black line is ema 4 and ema 14 macd its name is macd main signal line
in all of this lines we can define divergence
when this lines crossing over and under from together each of this crossings give me some signals and because this signals very much we cant describe thats in some lines
but note that we in fact trade just by black line but short and long position determine by position of black line instead of other lines and positions of other lines from each ones
purple line is rsi line
red line is composite line
blue line is rmi line
red and Blue below line is Slow Stochastic lines
blue and orange line is Stochastic ema with ema12 - ema21
and third chart is a secret indicator that help more to determine best place to start trading
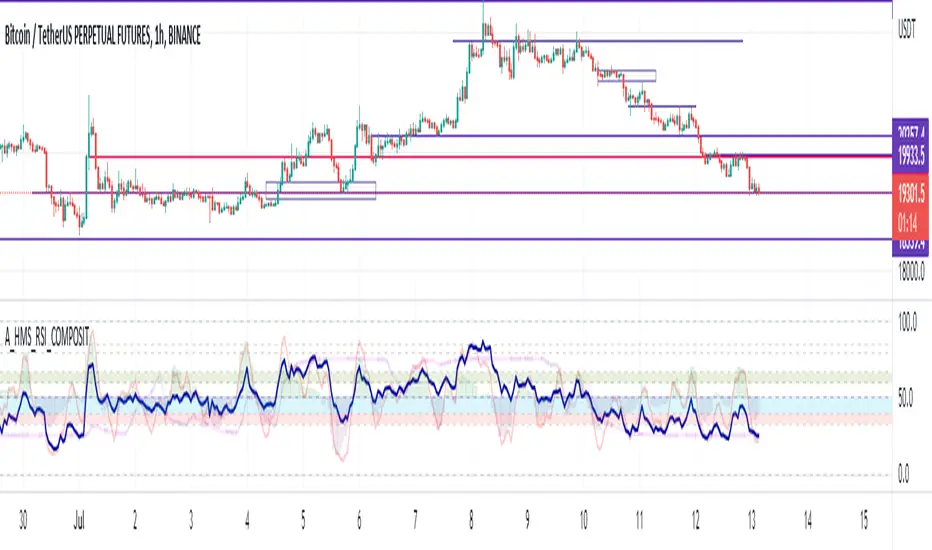
A_HMS_RSI is My great Indicator that RSI , RMI and , momentum of price movement by a histogram , that help you to trading without any problem
for better use note that:
blue line is rsi line with hl2 source and 14 length
low color line is rmi line with momentum 33
rmi of price with momentum 33 is a very good signal for long positions.
momentum histogram help us to define strong of price motion in each time
some futures is hidden by default:
composite red and green signal line
rmi of price with momentum 4
ema 13, 33 of rmi as signal line and rsi and composit
finaly u can change any colors from setting
in background we determine some filled zones for better use of Indicator
when composite line run away from histogram momentum increase rapidly
when composite and rsi line is in same way its time to get position .
rmi of price with momentum 20 is a very good signal for long positions.
some futures is hidden by default:
composite red and green signal line
rmi of price with momentum 20
ema 13, 33 of rmi as signal line
finaly u can change any colors from setting
and you can get stoch signals too
in background we determine some filled zones for better use of Indicator
for better use note that:
green fill line is ema 66 and ema 199 macd and signal its name is macd very slow signal line
blue fill line is ema 19 and ema 66 macd and signal its name is macd normal signal line
red fill line is ema 9 and ema 19 macd and signal its name is macd very fast signal line
black line is ema 4 and ema 14 macd its name is macd main signal line
in all of this lines we can define divergence
when this lines crossing over and under from together each of this crossings give me some signals and because this signals very much we cant describe thats in some lines
but note that we in fact trade just by black line but short and long position determine by position of black line instead of other lines and positions of other lines from each ones
purple line is rsi line
red line is composite line
blue line is rmi line
red and Blue below line is Slow Stochastic lines
blue and orange line is Stochastic ema with ema12 - ema21
and third chart is a secret indicator that help more to determine best place to start trading
A_HMS_RSI is My great Indicator that RSI , RMI and , momentum of price movement by a histogram , that help you to trading without any problem
for better use note that:
blue line is rsi line with hl2 source and 14 length
low color line is rmi line with momentum 33
rmi of price with momentum 33 is a very good signal for long positions.
momentum histogram help us to define strong of price motion in each time
some futures is hidden by default:
composite red and green signal line
rmi of price with momentum 4
ema 13, 33 of rmi as signal line and rsi and composit
finaly u can change any colors from setting
in background we determine some filled zones for better use of Indicator
when composite line run away from histogram momentum increase rapidly
when composite and rsi line is in same way its time to get position .
rmi of price with momentum 20 is a very good signal for long positions.
some futures is hidden by default:
composite red and green signal line
rmi of price with momentum 20
ema 13, 33 of rmi as signal line
finaly u can change any colors from setting
and you can get stoch signals too
in background we determine some filled zones for better use of Indicator
開源腳本
秉持TradingView一貫精神,這個腳本的創作者將其設為開源,以便交易者檢視並驗證其功能。向作者致敬!您可以免費使用此腳本,但請注意,重新發佈代碼需遵守我們的社群規範。
免責聲明
這些資訊和出版物並非旨在提供,也不構成TradingView提供或認可的任何形式的財務、投資、交易或其他類型的建議或推薦。請閱讀使用條款以了解更多資訊。
開源腳本
秉持TradingView一貫精神,這個腳本的創作者將其設為開源,以便交易者檢視並驗證其功能。向作者致敬!您可以免費使用此腳本,但請注意,重新發佈代碼需遵守我們的社群規範。
免責聲明
這些資訊和出版物並非旨在提供,也不構成TradingView提供或認可的任何形式的財務、投資、交易或其他類型的建議或推薦。請閱讀使用條款以了解更多資訊。