OPEN-SOURCE SCRIPT
Intraday Perpetual Premium & Z-Score
This indicator measures the real-time premium of a perpetual futures contract relative to its spot market and interprets it through a statistical lens.
It helps traders detect when funding pressure is building, when leverage is being unwound, and when crowding in the futures market may precede volatility.
How it works
• Premium (%) = (Perp – Spot) ÷ Spot × 100
The script fetches both spot and perpetual prices and calculates their percentage difference each minute.
• Rolling Mean & Z-Score
Over a 4-hour look-back, it computes the average premium and standard deviation to derive a Z-Score, showing how stretched current sentiment is.
• Dynamic ±2σ Bands highlight statistically extreme premiums or discounts.
• Rate of Change (ROC) over one hour gauges the short-term directional acceleration of funding flows.
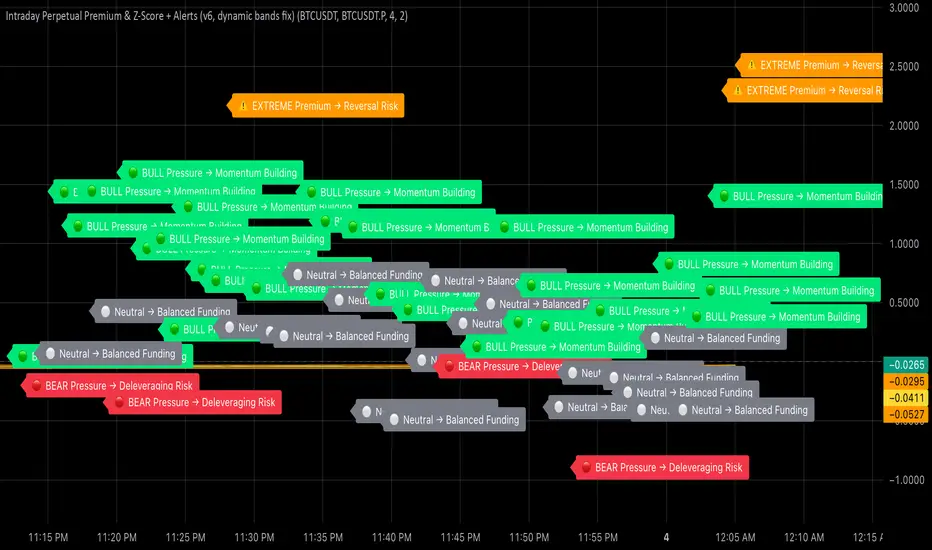
Colour & Label Interpretation
Visual cue Meaning Trading Implication
🟢 Green bars + “BULL Pressure” Premium rising faster than mean Leverage inflows → momentum strengthening
🔴 Red bars + “BEAR Pressure” Premium shrinking Leverage unwind → pull-back or consolidation
⚠️ Orange “EXTREME Premium/Discount” Crowded trade → heightened reversal risk
⚪ Grey bars Neutral Balanced conditions
Alerts
• Bull Pressure Alert → funding & premium rising (momentum building)
• Bear Pressure Alert → premium falling (deleveraging)
• Extreme Premium Alert → crowded longs; potential top
• Extreme Discount Alert → capitulation; possible bottom
Use case
Combine this indicator with your Heikin-Ashi, RSI, and MACD confluence rules:
• Enter only when your oscillators are low → curling up and Bull Pressure triggers.
• Trim or exit when Bear Pressure or Extreme Premium appears.
• Watch for Extreme Discount during flushes as an early bottoming clue.
It helps traders detect when funding pressure is building, when leverage is being unwound, and when crowding in the futures market may precede volatility.
How it works
• Premium (%) = (Perp – Spot) ÷ Spot × 100
The script fetches both spot and perpetual prices and calculates their percentage difference each minute.
• Rolling Mean & Z-Score
Over a 4-hour look-back, it computes the average premium and standard deviation to derive a Z-Score, showing how stretched current sentiment is.
• Dynamic ±2σ Bands highlight statistically extreme premiums or discounts.
• Rate of Change (ROC) over one hour gauges the short-term directional acceleration of funding flows.
Colour & Label Interpretation
Visual cue Meaning Trading Implication
🟢 Green bars + “BULL Pressure” Premium rising faster than mean Leverage inflows → momentum strengthening
🔴 Red bars + “BEAR Pressure” Premium shrinking Leverage unwind → pull-back or consolidation
⚠️ Orange “EXTREME Premium/Discount” Crowded trade → heightened reversal risk
⚪ Grey bars Neutral Balanced conditions
Alerts
• Bull Pressure Alert → funding & premium rising (momentum building)
• Bear Pressure Alert → premium falling (deleveraging)
• Extreme Premium Alert → crowded longs; potential top
• Extreme Discount Alert → capitulation; possible bottom
Use case
Combine this indicator with your Heikin-Ashi, RSI, and MACD confluence rules:
• Enter only when your oscillators are low → curling up and Bull Pressure triggers.
• Trim or exit when Bear Pressure or Extreme Premium appears.
• Watch for Extreme Discount during flushes as an early bottoming clue.
開源腳本
秉持TradingView一貫精神,這個腳本的創作者將其設為開源,以便交易者檢視並驗證其功能。向作者致敬!您可以免費使用此腳本,但請注意,重新發佈代碼需遵守我們的社群規範。
免責聲明
這些資訊和出版物並非旨在提供,也不構成TradingView提供或認可的任何形式的財務、投資、交易或其他類型的建議或推薦。請閱讀使用條款以了解更多資訊。
開源腳本
秉持TradingView一貫精神,這個腳本的創作者將其設為開源,以便交易者檢視並驗證其功能。向作者致敬!您可以免費使用此腳本,但請注意,重新發佈代碼需遵守我們的社群規範。
免責聲明
這些資訊和出版物並非旨在提供,也不構成TradingView提供或認可的任何形式的財務、投資、交易或其他類型的建議或推薦。請閱讀使用條款以了解更多資訊。