OPEN-SOURCE SCRIPT
Auto Fib Retracement [Syafiq.Jr]
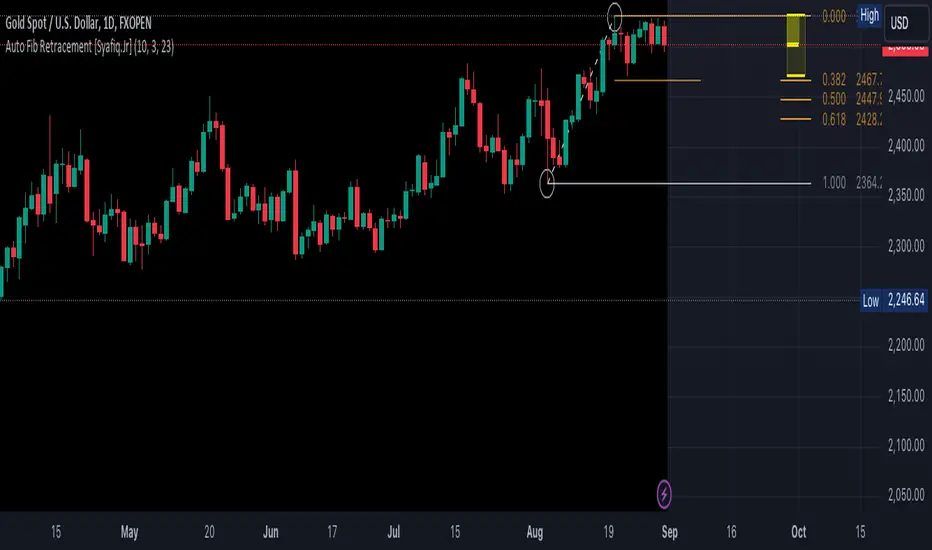
This TradingView script is an advanced indicator titled "Auto Fib Retracement Neo [Syafiq.Jr]." It's designed to automatically plot Fibonacci retracement levels on a price chart, aiding in technical analysis for traders. Here's a breakdown of its functionality:
Core Functionality:
The script identifies pivot points (highs and lows) on a chart and draws Fibonacci retracement lines based on these points. The lines are dynamic, updating in real-time as the market progresses.
Customizable Inputs:
Depth: Determines the minimum number of bars considered in the pivot point calculation.
Deviation: Adjusts the sensitivity of the script in identifying new pivots.
Fibonacci Levels: Allows users to select which retracement levels (236, 382, 500, 618, 786, 886) are displayed on the chart.
Visual Settings: Customization options include the colors and styles of pivot points, trend lines, and the retracement meter.
Pivot and Line Calculation:
The script calculates the deviation between the current price and the last pivot point. If the deviation exceeds a certain threshold, it identifies a new pivot and draws a trend line between the previous pivot and the current one.
Visual Aids:
The indicator provides extensive visual aids, including pivot points marked with circles, dashed trend lines connecting pivots, and labels displaying additional information like price and delta rate.
Performance:
Optimized to handle large datasets, the script is configured to process up to 4000 bars and can manage numerous lines and labels efficiently.
Background and Appearance:
The script allows for customization of the chart background color, enhancing visibility based on user preferences.
In essence, this script is a powerful tool for traders who rely on Fibonacci retracement levels to identify potential support and resistance areas, allowing for a more automated and visually guided approach to market analysis.
開源腳本
秉持TradingView一貫精神,這個腳本的創作者將其設為開源,以便交易者檢視並驗證其功能。向作者致敬!您可以免費使用此腳本,但請注意,重新發佈代碼需遵守我們的社群規範。
免責聲明
這些資訊和出版物並非旨在提供,也不構成TradingView提供或認可的任何形式的財務、投資、交易或其他類型的建議或推薦。請閱讀使用條款以了解更多資訊。
開源腳本
秉持TradingView一貫精神,這個腳本的創作者將其設為開源,以便交易者檢視並驗證其功能。向作者致敬!您可以免費使用此腳本,但請注意,重新發佈代碼需遵守我們的社群規範。
免責聲明
這些資訊和出版物並非旨在提供,也不構成TradingView提供或認可的任何形式的財務、投資、交易或其他類型的建議或推薦。請閱讀使用條款以了解更多資訊。