OPEN-SOURCE SCRIPT
已更新 MarketSmith Indicator
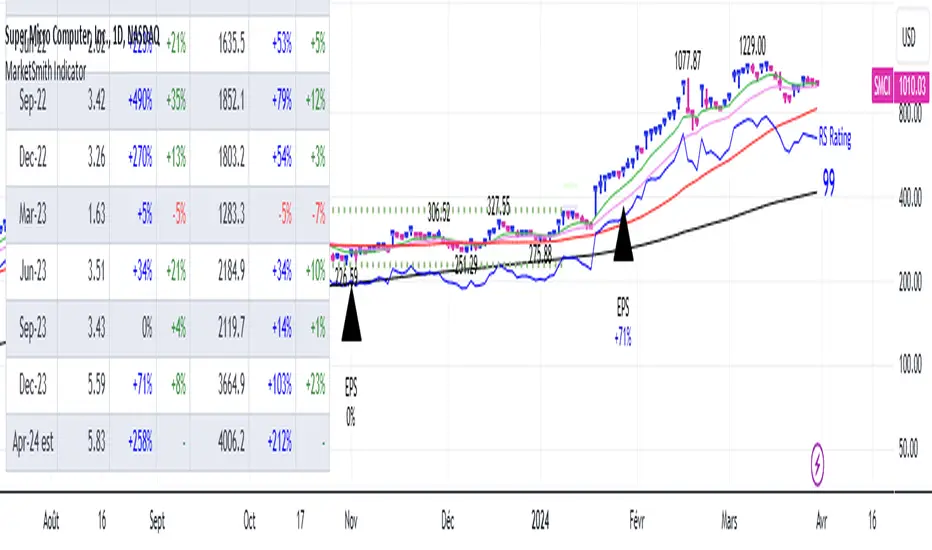
This script provides you with several indicators that will enable you to mimic MarketSmith charts, even with a free TradingView plan.
You can use this script with my 'EPS & Sales' indicator.
MarketSmith-style bars
The script offers an original approach to managing candlesticks within the code, making them almost identical to those on MarketSmith.
For a perfect display, select 'Bars' on your chart and set the opacity of your candles to 100% to display only the candles proposed by this indicator.
If you don't want them, you can simply disable them in the 'Style' tab by unchecking 'MarketSmith Bars' and 'Chars'.
These candles are designed to be used with a fix chart. (No beautiful result with zooming in or out.)
Normally, the display will still be correct by right-clicking, and 'Reset Chart'.
Simple customizable moving averages
With automatic distinction of the weekly time unit. You can choose to display them or not, select the calculation method and modify their length via the panel.
The RS Rating indicator
I've integrated the RS Rating indicator into this script, as the RS Rating is a fundamental component of this layout.
High and valley points
These points are used by MarketSmith to detect bases, patterns, cup & handle.
Designed for US Market only you won't be able to screen correctly the India market for example.
發行說明
- Now 'Hide RS Line' is working- Corrected a bug where when the current close was equal to that of the previous candle, the script colored pink, while TradingView colored blue. (Thank you Yaron_)
發行說明
- You can now customize the color of the bars- You can now display % variation of Peak/Valley points
發行說明
- Added the Weekly Tight Closes Detector available on 'Mark Minervini' script發行說明
- Now SMA/EMA colors are customizable發行說明
- Added Optional Beta Chart Recognition Pattern發行說明
- Corrected Graph Display發行說明
- Corrected graph again發行說明
- Corrected a minor bug that deleted hisotorical valid flat bases發行說明
- Added Double Bottom Detection- Pattern are only detected in Daily TimeFrame
發行說明
- Forgot to link the ability not to display patterns, corrected!發行說明
- Added recent modification on the RS Rating發行說明
- Modified label size to tiny發行說明
- Adjust some parameters in the base formation to be closer to MarketSmith- Corrected some bugs with the double bottom detection
發行說明
- Little correction for the initial depth of the creation of a base -> 35% to 40%發行說明
- Changed default Depth and Length values to better match MarketSmith Chart Pattern Recognition system發行說明
- Corrected Input Description for Double Bottom Depth and Length發行說明
- Corrected some parameters for base detection- Changed Dotted Lines to Dashed lines
- More discreet line rendering
發行說明
- Chart updated發行說明
- Chart Updated (Try to find a correct display)發行說明
- Back to the previous style display because bases were hard to see發行說明
- Added Beta Cup Detection (not Cup n Handle yet)- Corrected bug of SPX display
發行說明
- Corrected incorrect depth setting發行說明
- Adaptation of offset display for sectors and indices發行說明
- Rs Rating label adjusted發行說明
- Added Default Blue Dot New High發行說明
- Now we can display the rating only, eg: for smartphone display發行說明
- Adapted the RS Rating Update!In this update, I propose to use an option to view the historical RS Rating. This method is an approximation, as the performance environment of US equities varies over time, whereas the historical RS Rating is calculated with fixed values. However, this option can be of interest when studying past setups, and can provide relevant indications.
發行說明
- We can add a second SMA/EMA on the RS Line.發行說明
- Corrected the rounding of the Average Volume發行說明
- Confused MarketSmith Volume and MarketSmith Indicator. It's late at night發行說明
- Added EPS & Sales Table due to recent TradingView free plan limitation發行說明
- Corrected the Comparative Symbol for Line input that wasn't correctly wired to the calculation.發行說明
- Removed unused input發行說明
For the EPS & Sales table- Corrected shifting color to transparent of the daily table
發行說明
- Added the Maj for the EPS & Sales indicator發行說明
- Corrected wrong digit on the 'versus' display on sales after B_Kaminski pointed it out發行說明
- Updated to EPS & Sales Table Toward MarketSurge look發行說明
- Like MarketSurge does, when a reported EPS number is missing the code will now search for the standard EPS for replacement.This will allow tickers like
Moreover it should make the EPS & Sales table usable for the Indian Market.
The RS Rating is unchanged and is still for the US Market Only
發行說明
EPS and Sales table:- Modified the style of the table toward MarketSurge look
- Used lighter grey for the MarketSmith table
發行說明
- Modify Chart preview開源腳本
本著TradingView的真正精神,此腳本的創建者將其開源,以便交易者可以查看和驗證其功能。向作者致敬!雖然您可以免費使用它,但請記住,重新發佈程式碼必須遵守我們的網站規則。
免責聲明
這些資訊和出版物並不意味著也不構成TradingView提供或認可的金融、投資、交易或其他類型的意見或建議。請在使用條款閱讀更多資訊。
開源腳本
本著TradingView的真正精神,此腳本的創建者將其開源,以便交易者可以查看和驗證其功能。向作者致敬!雖然您可以免費使用它,但請記住,重新發佈程式碼必須遵守我們的網站規則。
免責聲明
這些資訊和出版物並不意味著也不構成TradingView提供或認可的金融、投資、交易或其他類型的意見或建議。請在使用條款閱讀更多資訊。