OPEN-SOURCE SCRIPT
Initial Balance Breakout + Fib
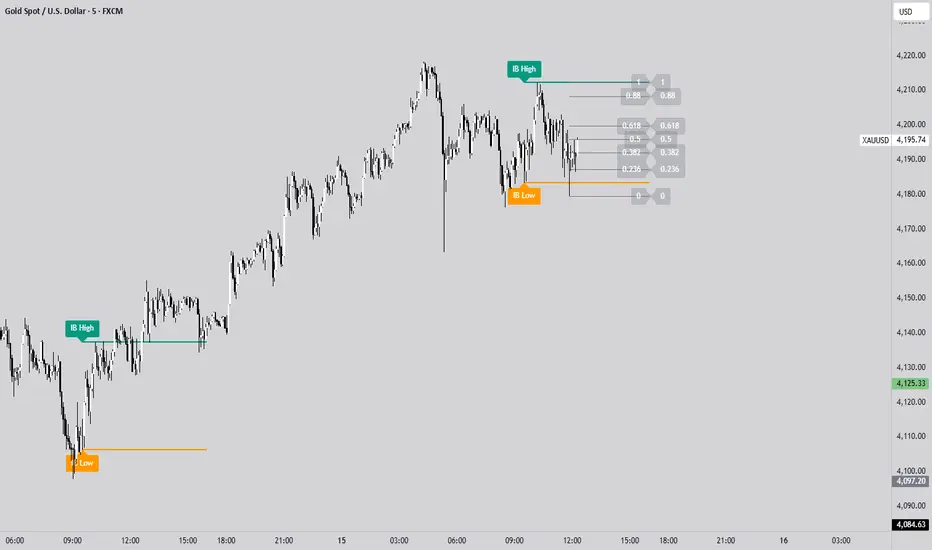
The IB High / Low + Auto-Fib indicator automatically plots the Initial Balance range and a Fibonacci projection for each trading day.
Define your IB start and end times (e.g., 09:30–10:30).
The indicator marks the IB High and IB Low from that session and extends them to the session close.
It keeps the last N days visible for context.
When price breaks outside the IB range, it automatically plots a Fibonacci retracement/extension from the opposite IB side to the breakout, using levels 0, 0.236, 0.382, 0.5, 0.618, 0.88, 1.
The Fib updates dynamically as the breakout extends, and labels are neatly aligned on the right side of the chart for clarity.
Ideal for traders who monitor Initial Balance breaks, range expansions, and Fibonacci reaction levels throughout the trading session.
開源腳本
本著TradingView的真正精神,此腳本的創建者將其開源,以便交易者可以查看和驗證其功能。向作者致敬!雖然您可以免費使用它,但請記住,重新發佈程式碼必須遵守我們的網站規則。
免責聲明
這些資訊和出版物並不意味著也不構成TradingView提供或認可的金融、投資、交易或其他類型的意見或建議。請在使用條款閱讀更多資訊。
開源腳本
本著TradingView的真正精神,此腳本的創建者將其開源,以便交易者可以查看和驗證其功能。向作者致敬!雖然您可以免費使用它,但請記住,重新發佈程式碼必須遵守我們的網站規則。
免責聲明
這些資訊和出版物並不意味著也不構成TradingView提供或認可的金融、投資、交易或其他類型的意見或建議。請在使用條款閱讀更多資訊。