OPEN-SOURCE SCRIPT
已更新 Bullish Kicker
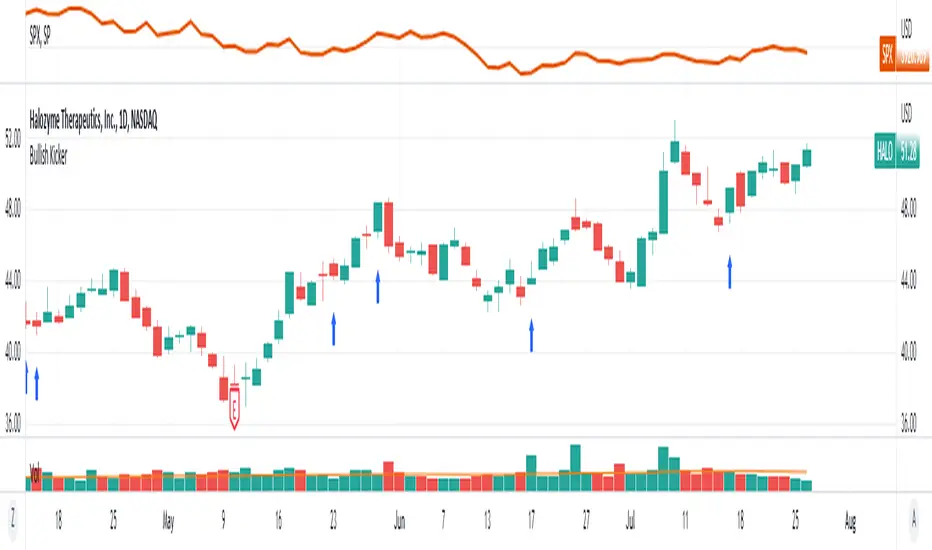
Identify bullish kicker candles on the chart. A bullish kicker candle occurs when the opening price is above the body of the previous candle. The previous candle must close lower than the open to qualify.
Indicator Settings
You can chose which shape and color to plot when a kicker candle occurs, as well as placement above, below or in a separate pane.
Bullish Kickers are indicated by blue arrows on the chart

Indicator Settings
You can chose which shape and color to plot when a kicker candle occurs, as well as placement above, below or in a separate pane.
Bullish Kickers are indicated by blue arrows on the chart
發行說明
Update fixes the overlay to be on the chart first, rather than a pane below發行說明
Fixes plot location to be below bars by default發行說明
Options to show only kickers where the opening price is the low of the day.發行說明
code clean up發行說明
Added the option to require a minimum gap amount to the kicker發行說明
Fixed a bug found in previous version開源腳本
秉持TradingView一貫精神,這個腳本的創作者將其設為開源,以便交易者檢視並驗證其功能。向作者致敬!您可以免費使用此腳本,但請注意,重新發佈代碼需遵守我們的社群規範。
Trusted Pine programmer. Send me a message for script development.
免責聲明
這些資訊和出版物並非旨在提供,也不構成TradingView提供或認可的任何形式的財務、投資、交易或其他類型的建議或推薦。請閱讀使用條款以了解更多資訊。
開源腳本
秉持TradingView一貫精神,這個腳本的創作者將其設為開源,以便交易者檢視並驗證其功能。向作者致敬!您可以免費使用此腳本,但請注意,重新發佈代碼需遵守我們的社群規範。
Trusted Pine programmer. Send me a message for script development.
免責聲明
這些資訊和出版物並非旨在提供,也不構成TradingView提供或認可的任何形式的財務、投資、交易或其他類型的建議或推薦。請閱讀使用條款以了解更多資訊。