OPEN-SOURCE SCRIPT
Tripple BB_13EMA
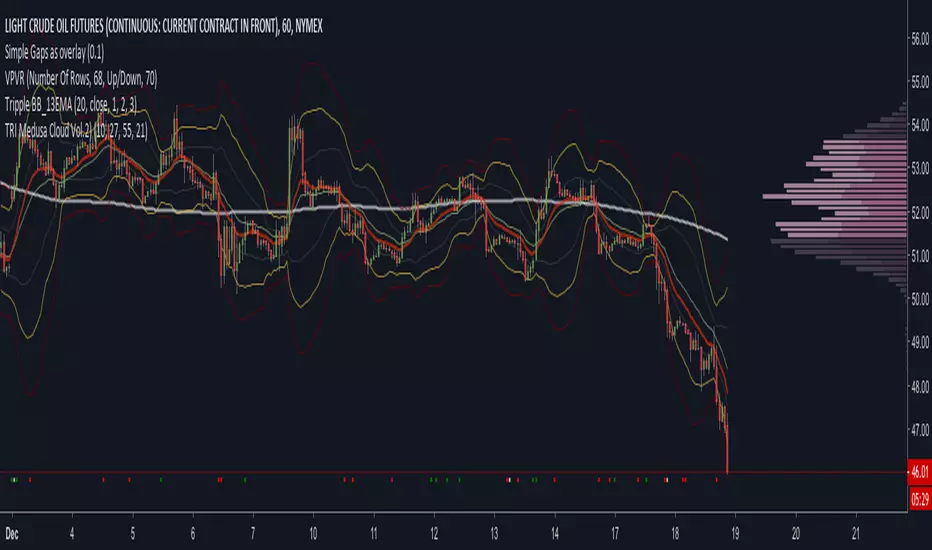
Here is a script to use 3 types of Bollinger Bands.
It is like three resistances or ranges in wich the Chart generally likes to move. A 1, 2 and 3 Width BB. The Chart moves 90% between the yellow one.
As support for my study i use the 13 EMA. is the Chart over the 13 EMA and under the Yellow (2) BB the trend is bullish. Is t under the 13 EMA and over the Yellow BB the trend used to be bearish.
The opener the BB are the more Volatilaty and the more likely the Chart will not bounce against the Bands. It will more get stick to the yellow or red one (if it is between them it is a trend too) and will follow up or downwards.
Check it out
開源腳本
本著TradingView的真正精神,此腳本的創建者將其開源,以便交易者可以查看和驗證其功能。向作者致敬!雖然您可以免費使用它,但請記住,重新發佈程式碼必須遵守我們的網站規則。
Murat Oers (CFTe)
免責聲明
這些資訊和出版物並不意味著也不構成TradingView提供或認可的金融、投資、交易或其他類型的意見或建議。請在使用條款閱讀更多資訊。
開源腳本
本著TradingView的真正精神,此腳本的創建者將其開源,以便交易者可以查看和驗證其功能。向作者致敬!雖然您可以免費使用它,但請記住,重新發佈程式碼必須遵守我們的網站規則。
Murat Oers (CFTe)
免責聲明
這些資訊和出版物並不意味著也不構成TradingView提供或認可的金融、投資、交易或其他類型的意見或建議。請在使用條款閱讀更多資訊。