OPEN-SOURCE SCRIPT
Heikin-Ashi Mean Reversion Oscillator [Alpha Extract]

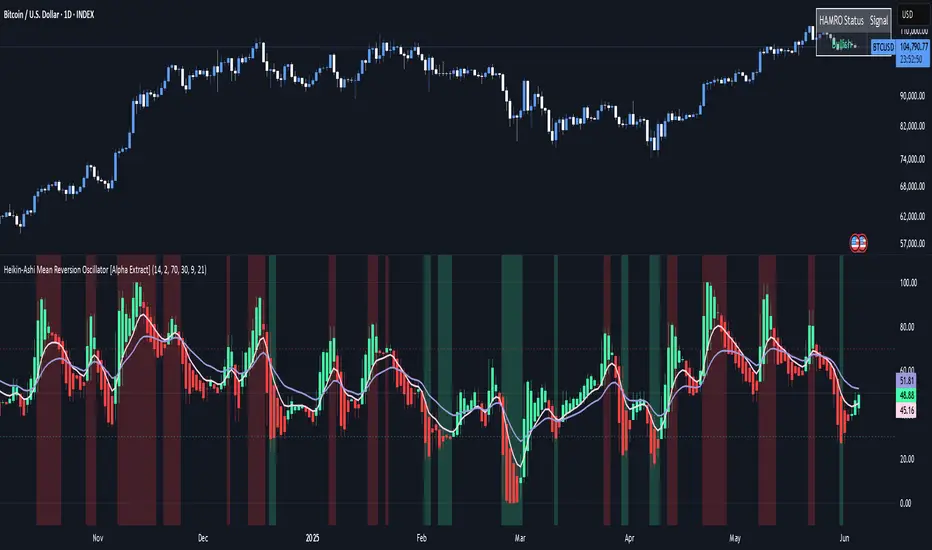
The Heikin-Ashi Mean Reversion Oscillator combines the smoothing characteristics of Heikin-Ashi candlesticks with mean reversion analysis to create a powerful momentum oscillator. This indicator applies Heikin-Ashi transformation twice - first to price data and then to the oscillator itself - resulting in smoother signals while maintaining sensitivity to trend changes and potential reversal points.
🔶 CALCULATION
🔶 DETAILS Visual Features:
🔶 EXAMPLES
🔶 SETTINGS
Customization Options:
🔶 CALCULATION
- Heikin-Ashi Transformation: Converts regular OHLC data to smoothed Heikin-Ashi values
- Component Analysis: Calculates trend strength, body deviation, and price deviation from mean
- Oscillator Construction: Combines components with weighted formula (40% trend strength, 30% body deviation, 30% price deviation)
- Double Smoothing: Applies EMA smoothing and second Heikin-Ashi transformation to oscillator values
- Signal Generation: Identifies trend changes and crossover points with overbought/oversold levels
Formula: - HA Close = (Open + High + Low + Close) / 4
- HA Open = (Previous HA Open + Previous HA Close) / 2
- Trend Strength = Normalized consecutive HA candle direction
- Body Deviation = (HA Body - Mean Body) / Mean Body * 100
- Price Deviation = ((HA Close - Price Mean) / Price Mean * 100) / Standard Deviation * 25
- Raw Oscillator = (Trend Strength * 0.4) + (Body Deviation * 0.3) + (Price Deviation * 0.3)
- Final Oscillator = 50 + (EMA(Raw Oscillator) / 2)
🔶 DETAILS Visual Features:
- Heikin-Ashi Candlesticks: Smoothed oscillator representation using HA transformation with vibrant teal/red coloring
- Overbought/Oversold Zones: Horizontal lines at customizable levels (default 70/30) with background highlighting in extreme zones
- Moving Averages: Optional fast and slow EMA overlays for additional trend confirmation
- Signal Dashboard: Real-time table showing current oscillator status (Overbought/Oversold/Bullish/Bearish) and buy/sell signals
- Reference Lines: Middle line at 50 (neutral), with 0 and 100 boundaries for range visualization
- Interpretation:
- Above 70: Overbought conditions, potential selling opportunity
- Below 30: Oversold conditions, potential buying opportunity
- Bullish HA Candles: Green/teal candles indicate upward momentum
- Bearish HA Candles: Red candles indicate downward momentum
- MA Crossovers: Fast EMA above slow EMA suggests bullish momentum, below suggests bearish momentum
- Zone Exits: Price moving out of extreme zones (above 70 or below 30) often signals trend continuation
🔶 EXAMPLES
- Mean Reversion Signals: When the oscillator reaches extreme levels (above 70 or below 30), it identifies potential reversal points where price may revert to the mean.
- Example: Oscillator reaching 80+ levels during strong uptrends often precedes short-term pullbacks, providing profit-taking opportunities.
- Trend Change Detection: The double Heikin-Ashi smoothing helps identify genuine trend changes while filtering out market noise.
- Example: When oscillator HA candles change from red to teal after oversold readings, this confirms potential trend reversal from bearish to bullish.
- Moving Average Confirmation: Fast and slow EMA crossovers on the oscillator provide additional confirmation of momentum shifts.
- Example: Fast EMA crossing above slow EMA while oscillator is rising from oversold levels provides strong bullish confirmation signal.
- Dashboard Signal Integration: The real-time dashboard combines oscillator status with directional signals for quick decision-making.
- Example: Dashboard showing "Oversold" status with "BUY" signal when HA candles turn bullish provides clear entry timing.
🔶 SETTINGS
Customization Options:
- Calculation: Oscillator period (default 14), smoothing factor (1-50, default 2)
- Levels: Overbought threshold (50-100, default 70), oversold threshold (0-50, default 30)
- Moving Averages: Toggle display, fast EMA length (default 9), slow EMA length (default 21)
- Visual Enhancements: Show/hide signal dashboard, customizable table position
- Alert Conditions: Oversold bounce, overbought reversal, bullish/bearish MA crossovers
- The Heikin-Ashi Mean Reversion Oscillator provides traders with a sophisticated momentum tool that combines the smoothing benefits of Heikin-Ashi analysis with mean reversion principles. The double transformation process creates cleaner signals while the integrated dashboard and multiple confirmation methods help traders identify high-probability entry and exit points during both trending and ranging market conditions.
開源腳本
秉持TradingView一貫精神,這個腳本的創作者將其設為開源,以便交易者檢視並驗證其功能。向作者致敬!您可以免費使用此腳本,但請注意,重新發佈代碼需遵守我們的社群規範。
Access more of our systems and insights at alphaextract.xyz
All analysis provided by Alpha Extract is for educational and informational purposes only.
All analysis provided by Alpha Extract is for educational and informational purposes only.
免責聲明
這些資訊和出版物並非旨在提供,也不構成TradingView提供或認可的任何形式的財務、投資、交易或其他類型的建議或推薦。請閱讀使用條款以了解更多資訊。